How to Calculate Your Break-Even After Averaging Down
Before you average down, you must know one number: your new break-even price. Not the price you need to "get back to even" from your original purchase — the price you need to break even after all your purchases combined. These are very different.
Key Takeaways
5 points- 1Break-even after averaging down = your new average cost per share (including all purchases).
- 2More shares at a lower price = lower break-even, but more total capital at risk.
- 3The math: new average = (lot1_shares × lot1_price + lot2_shares × lot2_price) ÷ total_shares.
- 4Averaging down requires a smaller % recovery to break even — but a larger absolute price move.
- 5Use the Stock Averager to calculate break-even before committing capital.
What Break-Even Means After Averaging Down
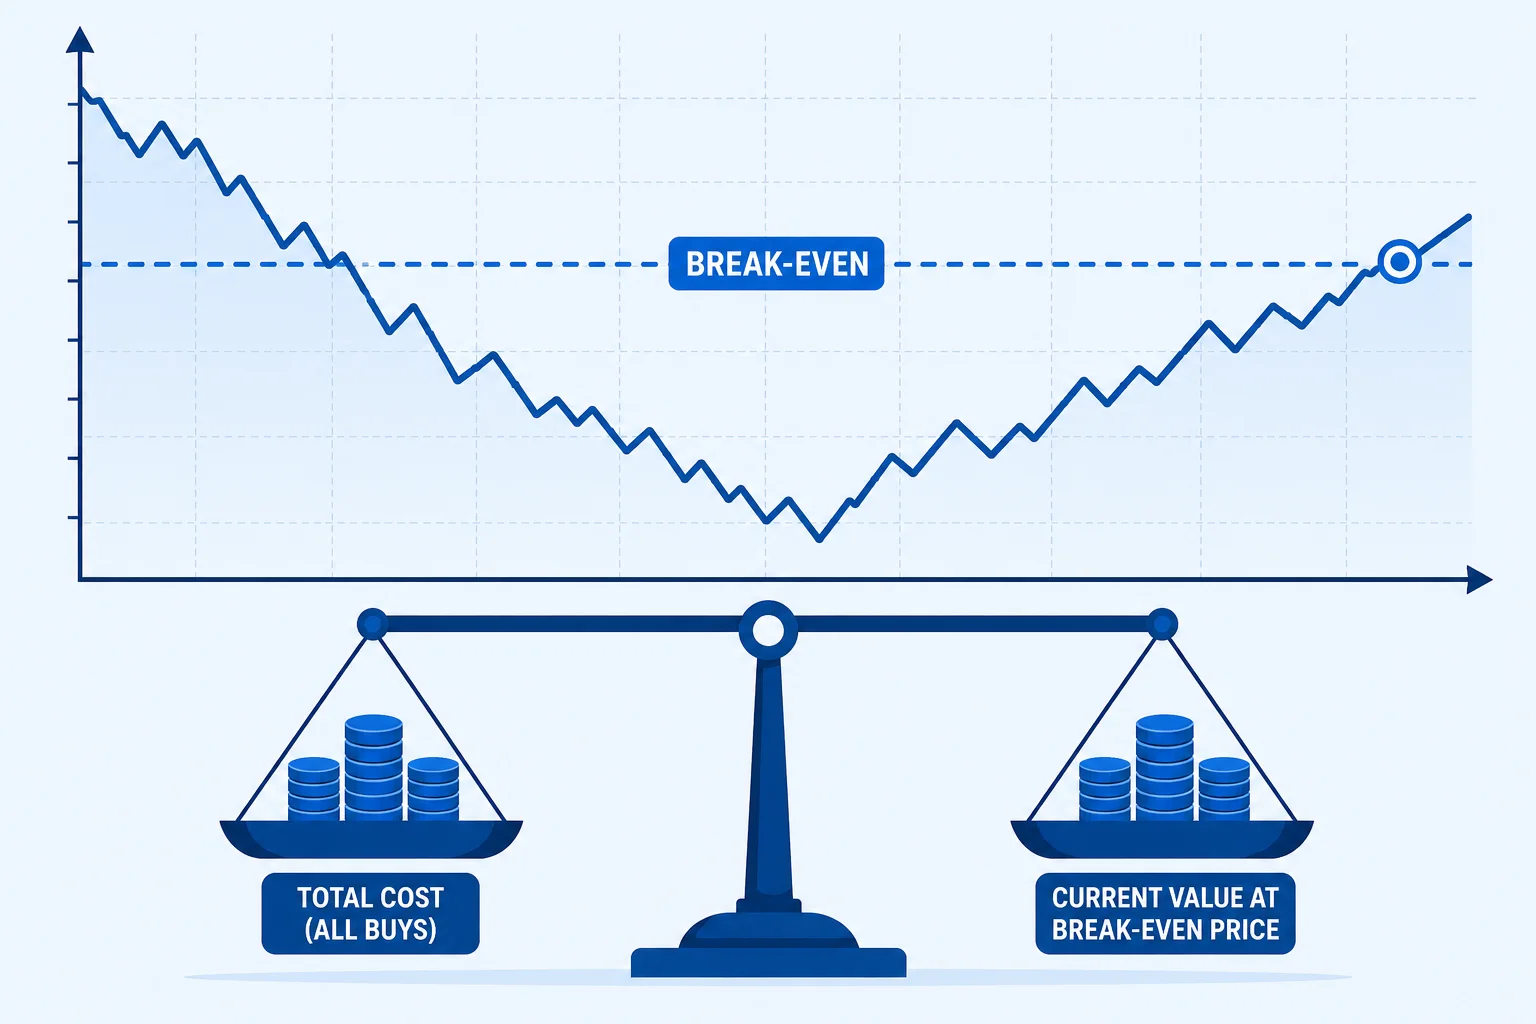
Your break-even price is the price at which you neither gain nor lose money on your total investment. If you've ever wondered how to calculate break-even after averaging down a stock, the key insight is this: when you average down, you buy more shares at a lower price, which lowers your break-even — but only in percentage terms. In absolute dollar/rupee terms, you now need the stock to reach a higher total value to recover all capital. This is the most common point of confusion in break-even after averaging down for beginners, so it's worth slowing down to understand it before adding to a losing position.
The Formula
New Average Cost (Break-Even)
New Average = (Lot 1 Shares × Lot 1 Price + Lot 2 Shares × Lot 2 Price) ÷ Total SharesFor multiple lots: sum all (shares × price) and divide by total shares owned.
Step-by-Step Example
Initial position: You buy 100 shares at $100 = $10,000 invested. Stock drops to $70. You're down $3,000 (30%).
Averaging down: You buy 100 more shares at $70 = $7,000 more invested. Total invested: $17,000 across 200 shares.
Calculating the new break-even
= (100 × $100 + 100 × $70) ÷ 200
= ($10,000 + $7,000) ÷ 200
= $17,000 ÷ 200
= $85 new break-even (vs. original $100)
You need a 21% recovery from $70 to $85 — versus a 43% recovery from $70 to $100 without averaging down. This is exactly what the new break-even price is after buying more shares at a lower price: a lower threshold to recover, even though your total capital exposure has grown. That's the power of the strategy when the business is sound.
The Trade-Off: Less % Recovery, More Capital At Risk
| Scenario | Total Invested | Break-Even Price | Recovery Needed |
|---|---|---|---|
| Hold only (100 shares at $100) | $10,000 | $100 | +43% from $70 |
| Average down 1x (+100 at $70) | $17,000 | $85 | +21% from $70 |
| Average down 2x (+200 more at $60) | $29,000 | $72.50 | +4% from $70 |
Notice: each additional averaging down reduces the break-even further, but doubles and triples your capital at risk. If the stock goes to zero, you lose more. Always weigh the break-even improvement against the additional capital concentration.
Using the Break-Even Calculator
Don't do this math manually. If you're looking for the simplest way to calculate a new average cost per share after averaging down, the Stock Averager Calculator computes the exact break-even after any combination of purchases. For a stripped-down break-even figure on a single position, the Break-even Calculator works too. Enter:
- Shares currently owned + original average price
- Current market price (what you'd pay for additional shares)
- Your desired target average (break-even)
The calculator shows exactly how many shares to buy to reach any target break-even price.
A Critical Warning: Opportunity Cost
Breaking even is not the same as making a good investment decision. If you deploy $7,000 averaging down a stock that recovers to your break-even in 3 years, you've made 0% on that capital. That same $7,000 in an index fund might have returned 30-40% over the same period.
Always compare: "If I average down, what is my realistic return vs. deploying this capital elsewhere?" Your break-even calculation is the floor — make sure the upside justifies the additional risk. Running the same capital through a SIP Calculator or a CAGR Calculator gives you a realistic benchmark to compare against.
Averaging Down vs. Dollar-Cost Averaging: Are They the Same?
A frequent beginner question is the difference between averaging down and dollar-cost averaging, since both lower your average cost. Dollar-cost averaging is a disciplined, scheduled approach — you invest a fixed amount on a regular cadence regardless of price, which naturally buys more shares when prices fall. Averaging down is a reactive, conviction-based decision: you deliberately add to a position specifically because it has dropped. The break-even math is identical for both, but the risk profile is not — averaging down concentrates capital into one stock that is already moving against you, while dollar-cost averaging usually spreads risk across time and often across a basket of assets.
Disclaimer
All examples are for educational illustration only. Past stock recovery patterns don't guarantee future results. Always consult a licensed financial advisor before making investment decisions.
About Stock Averager Team
Expert financial analysts dedicated to simplifying complex investment strategies for everyone. We build tools that help you make better money decisions.