
Sector Rotation: Investing with the Economic Cycle
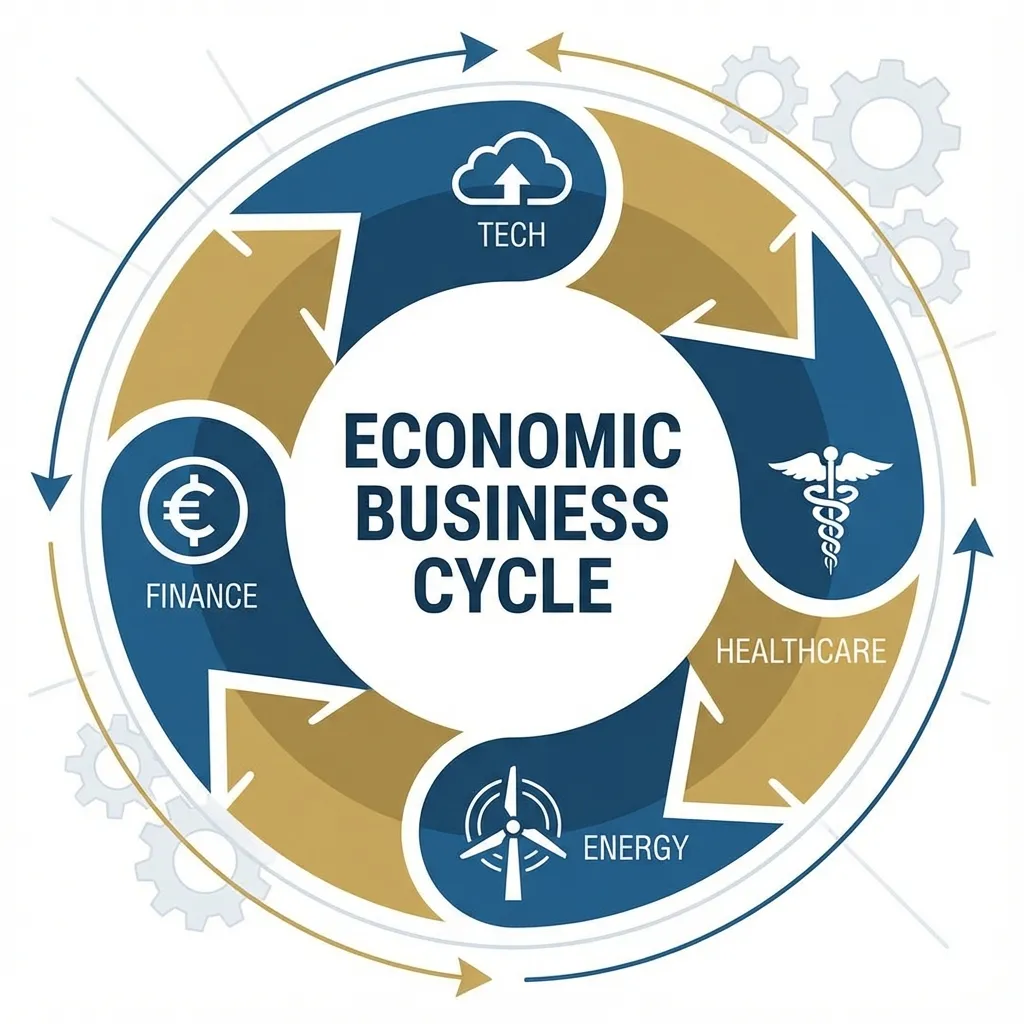
The stock market is not a single monolith that moves up and down in unison. It is a disparate collection of 11 distinct sectors, each with its own personality, drivers, and season. Technology stocks hate high interest rates; Bank stocks love them. Energy stocks thrive on inflation; Consumer Discretionary stocks die from it. Consumer Staples ignore the economy entirely to sell toothpaste to everyone. Sector Rotation is the art of acting as a portfolio "General," skillfully moving your troops (capital) from one battlefield to another to align with the changing economic weather. It is the strategy used by the largest hedge funds in the world to generate "Alpha" (excess returns) when the broad market is flat.
Key Takeaways
7 points- 1The Economic Clock: The economy moves in a predictable 4-stage cycle (Early, Mid, Late, Recession). Different sectors lead in each stage.
- 2The Leaderboard Shuffles: The best performing sector of 2023 is statistically unlikely to be the best performer of 2024. Winners rotate.
- 3Early Cycle: When the economy recovers from a recession, buy Financials, Real Estate, and Consumer Discretionary (Cyclicals).
- 4Mid Cycle: As growth stabilizes, Tech and Industrials take the lead.
- 5Late Cycle: When inflation heats up and the Fed raises rates, Energy and Materials outperform.
- 6Recession: When the music stops, cash flows into 'Defensive' sectors like Utilities, Healthcare, and Consumer Staples.
- 7Execution: You don't need to pick individual stocks. You can rotate using liquid Sector ETFs (XLF, XLK, XLE, XLV).
Part 1: The Concept of "Economic Seasons"
Imagine if you wore a heavy parka to the beach in July, or a swimsuit to the mountains in January. You would be uncomfortable, miserable, and possibly physically harmed. If you have been wondering what is sector rotation in the stock market, this seasonal mismatch is the perfect mental model to start with.
Investing in the wrong sector at the wrong time is exactly like that. Holding high-growth, no-profit Tech stocks (like ARKK) during an inflationary rate-hike cycle (2022) is like wearing a swimsuit in a blizzard. You will freeze to death financially. Conversely, holding boring Utility stocks during a booming economic recovery (2020) is like wearing a parka in the desert—you miss all the fun.
The Market is a Leading Indicator
This is the most critical concept to understand: The Stock Market is not the Economy.
The Stock Market looks forward 6 to 9 months. It crashes before the recession starts (anticipating pain). It bottoms and rallies before the economy recovers (anticipating growth). If you wait for the GDP data to be good before buying Cyclicals, you are already too late. Sector Rotation requires you to anticipate the next season, not react to the current one.
Part 2: The 4 Stages of the Business Cycle
According to the classic model developed by Sam Stovall (Chief Investment Strategist at CFRA), the economic cycle has four distinct phases, moving clockwise like a watch. Learning how to identify the business cycle stage is the single most important skill in this strategy, because each phase hands leadership to a different group of sectors.
Economy: GDP is negative but improving. Interest rates are low (cut by the Fed). Consumer confidence is low but bottoming. "Things are less bad."
Best Sectors: Financials, Real Estate, Consumer Discretionary.
Economy: Healthy growth. Inflation is moderate. The Fed is neutral. Corporate profits are expanding. This is usually the longest phase.
Best Sectors: Technology, Industrials, Communication Services.
Economy: Inflation spikes. The economy runs too hot. The Fed hikes rates to cool things down. Growth slows. Input costs rise.
Best Sectors: Energy, Materials, Commodities.
Economy: GDP contracts. Profits fall. Unemployment rises. Investors flee to safety and yields.
Best Sectors: Utilities, Consumer Staples, Healthcare.
Part 3: Deep Dive - Early Cycle Strategy
The darkest hour is just before the dawn. This stage happens when the news headlines are terrible, unemployment is high, but the stock market starts to sniff out a recovery. Rates are usually cut to zero to stimulate growth.
Banks benefit from the "yield curve steepening" (borrowing short at 0% and lending long at higher rates). As the economy restarts, loan demand picks up. Be careful of bad debt, but generally, banks lead recoveries.
Low interest rates make mortgages cheap. People buy homes. REITS refi their debt. Example: The 2020-2021 Housing Boom was driven by 2.5% mortgage rates.
People feel richer as jobs return. They buy cars (Ford), luxury goods (LVMH), and go to Starbucks. These stocks soar off the bottom as consumer spending roars back.
Part 4: Deep Dive - Mid Cycle Strategy
This is the longest phase of the cycle. The panic is over. Businesses are executing. The easy money has been made, and now it's about earnings growth versus valuation.
Companies spend their new profits on software and efficiency. Tech stocks provide the growth investors crave. This is the era of Apple, Microsoft, and Nvidia dominance.
Factories run at full capacity. Shipping companies (FedEx) and Plains/Trains (Union Pacific) are busy moving goods. Construction equipment (Caterpillar) is in high demand.
Google, Meta, Netflix. Advertising budgets return as corporate confidence peaks. People subscribe to services and consume media.
Part 5: Deep Dive - Late Cycle Strategy
The party is getting too rowdy. Inflation arrives. The cost of everything goes up (wages, raw materials, rent). This kills Tech stocks (whose future earnings are heavily discounted), but it boosts tangible assets.
Oil companies are the kings of inflation. If oil goes to $100, Exxon Mobil prints money while everyone else suffers high costs. In 2022, the S&P 500 was down 19%, but Energy was UP 60%. It was the only place to hide.
Miners, Copper, Steel, Chemicals. The raw ingredients of the economy become expensive due to scarcity. Companies like Freeport-McMoRan and Newmont Mining generally outperform.
Part 6: Deep Dive - Recession Strategy
The "Risk Off" phase. The goal here is not necessarily to make money, but to lose less than everyone else. Capital hides in "Defensives" – things people buy because they have to, not because they want to.
Coca-Cola, Procter & Gamble, Walmart. No matter how bad the economy is, people still buy toothpaste, toilet paper, and cheap food. These dividends are safe.
Johnson & Johnson, Pfizer. People don't stop taking heart medication because GDP is down. These earnings are resilient to economic shocks.
Duke Energy, NextEra. You still pay your electric bill. Plus, these stocks pay high dividends (3-4%), which effectively act like bonds when bond yields fall.
Part 7: How to Execute This Strategy
You don't need a PhD or a Bloomberg Terminal to do this. Here is how to rotate sectors using ETFs in practice: you just need to pay attention to the macro signals and act with discipline. This is also one of the most practical sector rotation strategies for beginners, because you trade a handful of liquid funds instead of hundreds of individual stocks.
The "Core & Satellite" Approach (Recommended)
Don't rotate your entire portfolio. That is too risky and creates tax nightmares. Instead, use a "Core & Satellite" approach to minimize risk while capturing alpha:
- 80% COREKeep 80% in a broad index like VOO (S&P 500) or VTI. This ensures you never miss a general market rally. You are never "out" of the market.
- 20% SATELLITEUse 20% of your account to "tilt" towards the favorable sector. If it's Late Cycle, put this 20% in energy (XLE). If it's Recession, put it in Staples (XLP).
Example: It's Late Cycle (High Inflation, 2022).
Your Portfolio: 80% VOO + 20% XLE (Energy).
Result: If tech crashes, your VOO takes a hit, but your XLE explodes, cushioning the blow. You lose 10% when everyone else loses 20%. That is a win.
Case Study: The 2022 Inflation Shock
Educational ExampleTech vs Energy Rotation
Stayed 100% in QQQ (Nasdaq). Inflation hit 9%. The Fed hiked rates faster than ever. Result: -33% loss. It took 2 years to recover heavily.
Saw CPI rising in late 2021. Sold 20% of Tech and bought Energy (XLE). While Tech crashed, Energy rallied 60%. Result: Flat / Slight Profit. They survived the bear market intact and had capital ready to deploy when Tech bottomed in 2023.
This is a hypothetical scenario using historical market data for educational purposes only. Past performance does not guarantee future results.
Part 8: Sub-Sector Rotation (The Advanced Game)
Within each sector, there are sub-sectors that also rotate. This is for the advanced sniper.
- Semiconductors (SMH): Highly cyclical. Lead rallies first.
- Software (IGV): Recurring revenue. More defensive/steady.
- Strategy: Buy Semis early in the bull run; switch to Software mid-cycle.
- Regional Banks (KRE): Risky, high beta. Lead early.
- Insurance (KIE): Very defensive. Hold up well in crashes.
- Strategy: Buy Banks when yield curve steepens; hide in Insurance when curves invert.
Part 9: Mixing Momentum with Rotation
Don't just guess the macro. Let the price confirm it. This is called "Relative Strength."
The Strategy:
Every month, look at the 11 Sector ETFs. Rank them by their 6-month performance. Buy the Top 3. Sell the Bottom 3.
This simple "Dual Momentum" strategy has historically outperformed the S&P 500 by reacting to trends rather than predicting them. It automatically gets you into Tech in bull markets and into Energy in inflation markets, without you needing to read a single Federal Reserve report. The price is the news.
Which Sectors Perform Best During High Inflation?
One of the most common questions investors ask is which sectors perform best during high inflation and rising interest rates. The answer is the "real asset" group: Energy (XLE) and Materials (XLB), because they sell tangible commodities whose prices rise with inflation rather than being eroded by it. In 2022, while the broad index fell roughly 19%, Energy gained around 60%—a textbook late-cycle outcome. Growth-heavy Technology, whose value depends on discounted future earnings, tends to suffer the most when rates climb. If you want to quantify the difference, run both legs through our CAGR calculator to compare annualized returns across a rate-hike cycle.
Part 10: The Risks of Rotation
This is an ACTIVE strategy. It carries risks that passive investing does not.
Sometimes the market fakes you out. Signals might suggest a Recession is coming, so you move to Utilities. Then, the Fed cuts rates unexpectedly, and Tech rips higher while Utilities lag. You underperform the market. This is the cost of doing business.
Every time you sell a sector ETF to buy another, you trigger a taxable event (Capital Gains). If you do this in a taxable brokerage account, you might lose 20% of your profits to the IRS. Before every switch, it pays to estimate the bill with a capital gains calculator so you know the true after-tax cost of the rotation. Best Practice: Execute this strategy in a tax-advantaged account like an IRA or 401k where trades are tax-free.
Sector Rotation and Interest Rates: A Cheat Sheet
If you only track one macro variable, make it the direction of interest rates. The Fed's policy path is the single biggest driver of which sectors lead, and the relationship is intuitive once you see it laid out. Rising rates raise borrowing costs and shrink the present value of far-off earnings (bad for growth Tech); falling rates do the opposite and ignite rate-sensitive cyclicals. Here is the quick reference for which sectors do well when interest rates rise vs fall.
| Rate Environment | Sectors That Tend to Lead | Sectors That Tend to Lag | Why |
|---|---|---|---|
| Rising Rates | Financials (XLF), Energy (XLE), Materials (XLB) | Tech (XLK), Real Estate (XLRE), Utilities (XLU) | Banks earn wider margins; real assets track inflation. Long-duration growth and rate-sensitive dividend payers get repriced lower. |
| Falling Rates | Tech (XLK), Consumer Discretionary (XLY), Real Estate (XLRE) | Financials (XLF), Energy (XLE) | Cheap money lifts growth valuations and housing. Bank net-interest margins compress as the yield curve flattens. |
| Rates On Hold (Neutral) | Industrials (XLI), Communication (XLC), broad Tech | Deep defensives (XLP, XLU) | A stable-rate "Goldilocks" backdrop rewards earnings growth over safety. |
Financials Cut Both Ways
Notice that Financials appear in both the "rising" and "early-cycle falling" columns. That is not a contradiction. Banks like rising rates for margins, but they like a steepening yield curve even more (short rates low, long rates higher). The worst case for banks is an inverted curve, which often precedes recession. Watch the shape of the curve, not just the level of rates.
Does Sector Rotation Actually Beat Buy-and-Hold?
Honest answer: sometimes, and less often than the marketing suggests. A common question is whether sector rotation actually works or whether it is just an expensive way to underperform an index fund. The evidence is mixed. Momentum-based rotation (buying the strongest sectors) has historically added a modest edge in some studies, but the excess return is small, arrives unevenly year to year, and gets partly eaten by trading costs and taxes.
The hard part is that the business cycle is obvious in hindsight and murky in real time. Nobody rings a bell to announce "Late Cycle has begun." You will be early sometimes and late other times, and a few whipsaws can wipe out a year of small gains. That is precisely why the Core & Satellite structure earlier in this guide is so important: it caps how much damage a wrong call can do.
- You trade inside a tax-advantaged account (IRA/401k) so switches are tax-free.
- The macro signal is clear (deep recession, obvious inflation shock).
- You limit yourself to a small "satellite" sleeve and rank by relative strength.
- You review quarterly and resist the urge to churn weekly.
- You are investing in a taxable account and trade frequently.
- The macro picture is muddy or signals conflict.
- You cannot commit to a rules-based process and would rotate on emotion.
- Your time horizon is decades, where cycle timing matters less than staying invested.
A reasonable middle path for most investors is to treat rotation as a tilt, not a strategy you bet the farm on. Compare the annualized result of your rotated sleeve against simply holding a broad index over the same window using our CAGR calculator. If your active tilting is not clearly beating the index after taxes and effort, that is valuable feedback, not a failure. For the mechanics of trimming winners and topping up laggards, our portfolio rebalancing guide pairs naturally with this approach.
FAQ: Sector Rotation
Where can I find the current sector performance?
How often should I rotate?
Can I just buy XLK (Tech) and hold it forever?
What if the signals are conflicting?
Sector rotation: what readers ask
What is the sector rotation strategy in simple terms?
Sector rotation is moving money between the 11 stock-market sectors to match the current stage of the economic cycle. Because different sectors lead in different conditions, you tilt toward the ones expected to outperform (like Energy in high inflation) and away from those likely to lag (like growth Tech when rates are rising). Most investors execute it with liquid sector ETFs rather than picking individual stocks.
What are the best sectors to invest in during a recession?
Defensive sectors historically hold up best: Consumer Staples (XLP), Healthcare (XLV), and Utilities (XLU). People keep buying groceries, medicine, and electricity no matter how bad the economy gets, so these earnings and dividends are resilient. The goal in a recession is usually to lose less than the market, not to score big gains.
Which sectors perform best when interest rates rise?
Financials, Energy, and Materials tend to lead when rates climb. Banks earn wider margins on loans, while Energy and Materials sell real commodities whose prices often rise with inflation. Long-duration growth sectors like Technology and rate-sensitive Real Estate usually lag because higher rates shrink the present value of their future earnings.
How often should you rotate sectors?
Quarterly is a sensible cadence for most investors, because full economic cycles play out over months to years, not weeks. Reviewing every three months lets you respond to genuine shifts in rates, inflation, and relative strength without churning your account on noise. Day-trading sectors mostly generates fees and taxes that erode any edge.
What is the difference between sector rotation and diversification?
Diversification means holding many sectors at once to reduce risk and smooth returns. Sector rotation is an active overlay that deliberately overweights and underweights specific sectors based on the cycle. You can do both: keep a diversified core index position, then tilt a small satellite sleeve toward the favored sector.
Can beginners use a sector rotation strategy?
Yes, but keep it small and rules-based. A beginner-friendly version is the Core & Satellite approach: hold roughly 80% in a broad index and rotate only about 20% into the leading sector ETF. Ranking sectors by 6-month relative strength removes most of the guesswork, and doing it inside a tax-advantaged account avoids the capital-gains drag that hurts frequent traders.
Be The Captain
Sector rotation is about taking control. It is realizing that there is always a bull market somewhere. Your job is to find it. Stop being a passenger on the market's rollercoaster. Be the driver.
Identify the Economic Season (Early, Mid, Late, Recession).
Check the charts (Is the leading sector confirming your thesis?)
Tilt 20% of your portfolio to the leader. Hold until the season changes.
Investment Risk Disclaimer
This content is for educational purposes only and should not be considered financial advice. All investments carry risk, including the potential loss of principal. Past performance does not guarantee future results. Before making any investment decisions, please consult with a qualified financial advisor who understands your personal financial situation, risk tolerance, and investment goals.
Stock Averager provides tools and educational content but does not provide personalized investment advice or recommendations.
Explore this topic in depth
Fundamentals & Valuation
Working out what a business is worth before deciding what its shares are worth paying.
- Stock Market Basics: Complete Beginner's Guide to Investing (2025) (main guide)How the market works and how to buy your first holding.
- P/E Ratio Explained: Are You Overpaying for Stocks?What the multiple tells you, and the traps in comparing it across sectors.
- How to Read Annual Reports: Financial Statements ExplainedFinding the story in the income statement, balance sheet and cash flows.
- How to Set a Target Price for a Stock: 4 Methods That WorkFour valuation methods for setting a defensible target.
- How to Calculate CAGR: Formula, Examples & Free Calculator (2026)The compounding formula, and why XIRR is correct for regular contributions.
- Index Funds vs Individual Stocks: Which Should You Choose?The trade-off between market returns and concentrated bets.
- Small Cap vs Large Cap: Where to Invest in 2026What you're really buying at each end of the size spectrum.
- Crypto Investing for Beginners: Beyond BitcoinA sober framework for an asset class with no earnings to value.
Related topics
- Technical AnalysisReading price and volume — what indicators genuinely measure, and where the popular claims break down.
- Dividends & Portfolio IncomeTurning holdings into cash flow — dividends, reinvestment, covered calls and structured withdrawals.
- Risk Management & Position SizingDeciding in advance how much you can lose — the part of investing that determines whether you survive.
About Stock Averager Team
Expert financial analysts dedicated to simplifying complex investment strategies for everyone. We build tools that help you make better money decisions.
Recommended Tools
Related Articles
Value Averaging: The Smarter DCA Alternative?
How to Build Wealth with Dollar Cost Averaging (Without Timing the Market)
Cost Averaging Explained: Dollar, Rupee, Pound & Euro Cost Averaging
Lump Sum vs DCA: When to Invest All at Once
Tax-Loss Harvesting: Turn Losses into Savings
What Is Averaging Down? Complete Beginner's Guide (2026)