How to Calculate CAGR: Formula, Examples & Free Calculator (2026)
The 80% That Tells You Nothing
Your investment grew from $10,000 to $18,000 over five years. Is that good? "It went up 80%" sounds impressive, but it tells you almost nothing you can actually compare. Was it a steady climb or a wild ride? How does it stack up against a fund that doubled in seven years?
CAGR — the compound annual growth rate — turns any messy, multi-year return into one clean number you can line up against stocks, funds, and time periods. That same 80% total works out to roughly 12.47% per year, compounded. Once you know how to calculate CAGR, you can judge almost any investment in seconds.
TL;DR — Quick Summary
30-sec read- 1CAGR = (Ending Value ÷ Beginning Value)^(1 ÷ Number of Years) − 1, expressed as a percentage.
- 2It is the constant yearly rate that would smoothly grow your start value into your end value — accounting for compounding.
- 3CAGR is not the same as average return; it is always lower than the simple average when returns are volatile.
- 4A 'good' CAGR depends on the asset: roughly 7–12% for broad equity index funds, less for bonds, more (with far higher risk) for growth stocks.
- 5CAGR hides volatility and assumes no cash flows — for regular contributions like a SIP, use IRR/XIRR instead.
Continue reading for the full guide with examples and strategies.
Who This Is For
Beginner LevelPerfect if you:
- You want to compare two investments held for different lengths of time
- A fund or stock pitch quotes a total return and you need the annual rate
- You are setting a realistic return assumption for a financial plan
- You keep confusing CAGR with the simple average of yearly returns
You'll learn:
- The exact CAGR formula and what each part of it does
- A step-by-step worked example you can follow with any numbers
- How to calculate CAGR in Excel or Google Sheets two ways
- Why CAGR differs from average return — and the trap that inflates numbers
- What counts as a good CAGR, plus the limitations you must respect
Not for you if:
💡 Being honest about who shouldn't read this builds trust and reduces bounce rate.
Key Takeaways
6 points- 1CAGR is the constant annual rate that would grow your starting value to your ending value over the full period — as if it compounded smoothly every year.
- 2The formula is: CAGR = (Ending Value ÷ Beginning Value)^(1 ÷ Number of Years) − 1.
- 3CAGR is not the same as average return — it accounts for compounding, so it's always lower than the simple average of yearly returns when returns are volatile.
- 4A 'good' CAGR depends on the asset: ~7–12% for broad equity index funds over the long run, more for individual growth stocks, less for bonds.
- 5CAGR hides the bumps — it tells you the smoothed rate, not the volatility or the worst year along the way.
- 6Use the CAGR Calculator to get the rate instantly, in any of 10 currencies.
What Is CAGR (Compound Annual Growth Rate)?
CAGR is the single annual growth rate that, if it repeated every year, would take your investment from its starting value to its ending value. It smooths out the real, lumpy path — the up years and the down years — into one representative number. That is exactly what makes it useful. A stock that returns +40%, −20%, +15%, −5%, and +30% across five years is impossible to judge at a glance, but its CAGR collapses all of that into "roughly 10% per year."
Because it builds in compounding, the compound annual growth rate is the honest way to compare two investments held for different lengths of time. "Fund A doubled in 7 years" and "Fund B tripled in 12 years" are not comparable until you convert both to CAGR — 10.4% versus 9.6%, meaning Fund A actually wins despite the smaller headline. This is why CAGR meaning matters far more than a raw total-return figure.
The CAGR Formula
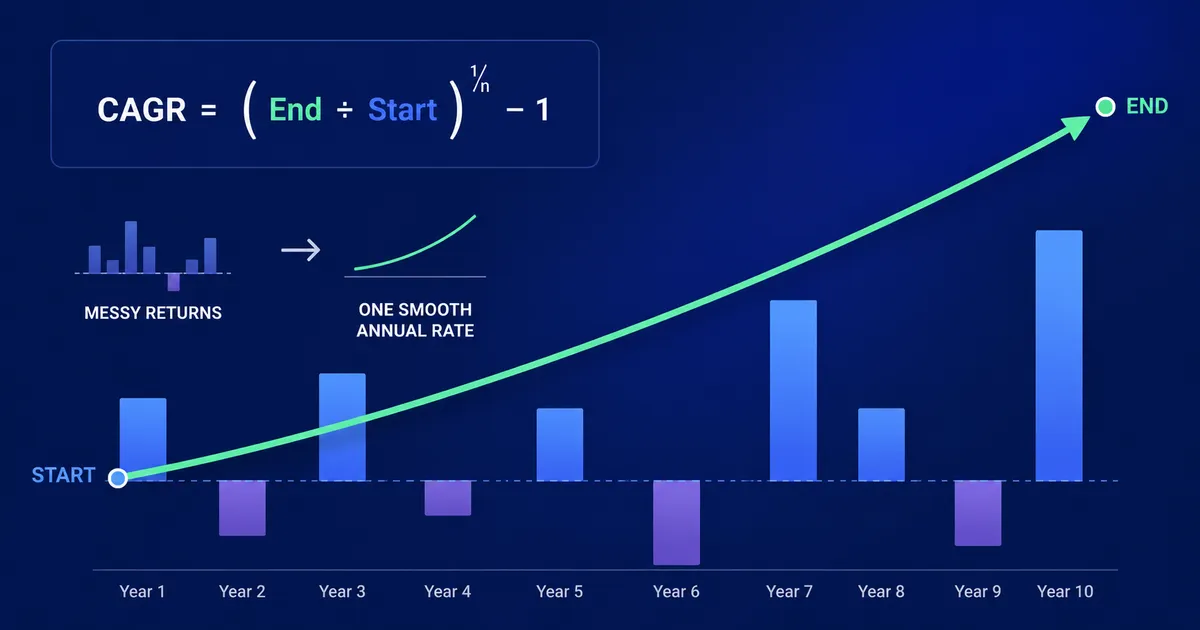
Compound annual growth rate formula
CAGR = (Ending Value ÷ Beginning Value) ^ (1 ÷ Number of Years) − 1Multiply the result by 100 to express it as a percentage.
You only need three inputs: where you started, where you ended, and how long it took. The exponent (1 ÷ Number of Years) is what "un-compounds" the total growth back into a per-year rate. Everything else in the CAGR formula is just division and subtraction.
How to Calculate CAGR: Step-by-Step Example
Say you invested $10,000 and it grew to $18,000 over 5 years. Here is how to calculate the compound annual growth rate by hand:
- Divide ending by beginning value: 18,000 ÷ 10,000 = 1.8
- Raise to the power of (1 ÷ years): 1.8 ^ (1 ÷ 5) = 1.8 ^ 0.2 = 1.1247
- Subtract 1: 1.1247 − 1 = 0.1247
- Convert to a percentage: 0.1247 × 100 = 12.47% CAGR
So your money grew at an effective 12.47% per year, compounded — even though it never actually returned exactly that in any single year. You can check this in reverse: 10,000 × 1.1247^5 ≈ 18,000.
How the Same Growth Looks at Different Time Horizons
One reason people misread returns is that they forget to divide by time. The table below shows the CAGR for a $10,000 investment that doubles to $20,000 — over different holding periods. The total return is identical, but the annualized rate falls sharply the longer it takes.
$10,000 to $20,000 (100% total return) at different horizons
| Years to Double | Total Return | CAGR |
|---|---|---|
| 3 years | 100% | 26.0% |
| 5 years | 100% | 14.9% |
| 7 years | 100% | 10.4% |
| 10 years | 100% | 7.2% |
This is also the source of the famous Rule of 72: divide 72 by the CAGR to estimate how many years it takes to double. A 7.2% CAGR doubles your money in about ten years — exactly what the last row shows. You can generate the same annualized figures for any start value, end value, and horizon using our CAGR calculator.
How to Calculate CAGR in Excel or Google Sheets
You do not need to type the exponent by hand in a spreadsheet. There are two easy ways to calculate CAGR in Excel, and both give the same answer:
Two Excel formulas for CAGR
= (Ending ÷ Beginning) ^ (1 ÷ Years) − 1= RATE(Years, 0, −Beginning, Ending)Format the cell as a percentage. The RATE function returns the same compound annual growth rate without typing the exponent yourself — for example, =RATE(5, 0, −10000, 18000) returns 12.47%.
The RATE function is the quickest route if you already have your figures in cells. Note the minus sign in front of the beginning value: Excel treats your initial investment as a cash outflow, so it must be negative for the CAGR rate function to work correctly.
CAGR vs Average Return: The Mistake That Inflates Your Numbers
This is the most common error in performance reporting, and it is worth understanding the CAGR vs average return gap before you trust any headline number. A simple average of yearly returns is almost always higher than the true CAGR, and the gap widens with volatility.
| Year | Return | Value of $10,000 |
|---|---|---|
| Year 1 | +50% | $15,000 |
| Year 2 | −50% | $7,500 |
The simple average says (50% − 50%) ÷ 2 = 0% return — sounds like you broke even. But you actually lost $2,500. The real CAGR is (7,500 ÷ 10,000)^(1/2) − 1 = −13.4% per year. CAGR tells the truth because it respects the order and compounding of returns; the simple average does not. Whenever someone quotes an "average annual return," ask whether they mean the arithmetic average or the CAGR — the difference can be enormous.
Why the gap exists
A percentage loss hurts more than the same percentage gain helps, because it is applied to a smaller base. Losing 50% requires a 100% gain to get back to even, not another 50%. CAGR captures this asymmetry automatically; a simple average ignores it entirely. This is why volatile assets can post a positive average return while their CAGR — and your actual wealth — went nowhere.
Comparing Two Funds With CAGR
Educational ExampleWhich fund actually performed better?
Fund A
- • Invested: $10,000
- • Grew to: $20,000
- • Held for: 7 years
- • CAGR: (20,000/10,000)^(1/7) − 1 = 10.4%
Fund B
- • Invested: $10,000
- • Grew to: $30,000
- • Held for: 12 years
- • CAGR: (30,000/10,000)^(1/12) − 1 = 9.6%
The Verdict
Fund B tripled while Fund A only doubled — so the raw total return favors Fund B. But once you annualize with CAGR, Fund A compounded faster (10.4% vs 9.6%) because it did its work in far less time. Without CAGR, you would have picked the slower performer. Figures are illustrative.
This is a hypothetical scenario using historical market data for educational purposes only. Past performance does not guarantee future results.
What Is a Good CAGR?
There is no universal "good" number — a good CAGR is only meaningful relative to the asset class and the risk you took to earn it. As rough long-run benchmarks:
| Asset | Typical long-run CAGR |
|---|---|
| Savings account / fixed deposit | 2–6% |
| Government / high-grade bonds | 4–7% |
| Broad equity index (S&P 500, Nifty 50) | 7–12% |
| Strong individual growth stocks | 15%+ (with far higher risk) |
Context matters by company stage too. A good CAGR for a mature company or small business in an established industry is often just 3–5%, while a good CAGR for a growth-stage company is 10–20%, and early-stage startups frequently target 50%+ to attract investors. A 9% CAGR from an index fund is excellent; the same 9% from a speculative small-cap you bet your savings on is a poor reward for the risk. Always read CAGR alongside how much volatility you stomached to get it, and over a stated window — a 3-year CAGR and a 5-year CAGR on the same stock can tell very different stories. If you are weighing steady index returns against concentrated bets, our guide on index funds vs individual stocks puts those risk-adjusted trade-offs side by side.
The Limitations of CAGR (Read This Before You Trust It)
- It hides volatility. Two funds can share a 10% CAGR while one dropped 60% mid-way and the other rose steadily. CAGR cannot tell them apart — pair it with a look at maximum drawdown.
- It assumes no cash flows. Standard CAGR uses only a start and end value. If you added money monthly (a SIP), CAGR overstates or understates your real return. This is the key CAGR vs IRR difference — IRR (internal rate of return) accounts for the timing of every deposit and withdrawal, so use it for regular contributions.
- It is backward-looking. A 15% historical CAGR is not a promise of 15% in the future.
- It is sensitive to endpoints. Start or end on a market peak or trough and the number swings wildly. Always note the exact dates.
CAGR vs IRR: when to use which
Use CAGR when there is a single lump-sum start value and a single end value with nothing added in between. The moment you make regular contributions or withdrawals, switch to IRR (or XIRR in a spreadsheet), which weights each cash flow by its timing. When there are no interim cash flows, CAGR and IRR produce exactly the same number. To see how monthly contributions change the math, model them with our SIP calculator.
How to Calculate CAGR for Months or Partial Years
CAGR does not require whole years. If you held an investment for 30 months, 18 months, or even 8 months, you can still annualize the return — you just express the time period as a fraction of a year in the exponent. The formula is identical; only the "Number of Years" input changes.
Convert the holding period to years
Years = Number of Months ÷ 12Years = Number of Days ÷ 365Then drop that fractional number straight into the standard CAGR formula in place of whole years.
Say $10,000 grew to $12,000 over 30 months. Convert the period first: 30 ÷ 12 = 2.5 years. Then apply the formula: (12,000 ÷ 10,000)^(1 ÷ 2.5) − 1 = 1.2^0.4 − 1 ≈ 7.57% CAGR. For an 8-month period, years = 8 ÷ 12 = 0.667, so the exponent becomes 1 ÷ 0.667 = 1.5 — which annualizes (scales up) a sub-year return rather than smoothing it down.
Be careful annualizing short periods
Annualizing anything under roughly 6 months can be badly misleading. A great two-month run scaled up to a yearly rate can imply a triple-digit "CAGR" that no investment sustains — it just projects a lucky streak across a whole year. For very short holding periods, report the plain holding-period return instead, and reserve CAGR for spans of a year or more.
Can You Calculate CAGR With Negative or Zero Values?
The standard CAGR formula breaks down in two situations, and it helps to know why before a spreadsheet hands you an error or a nonsense number:
- A beginning value of zero. You cannot divide by zero, so CAGR is undefined if the investment started at $0. There is no meaningful "growth rate" from nothing to something.
- A negative starting value. If the beginning figure is negative (common when charting company profit that started at a loss), taking a fractional root of a negative number produces a complex number or a spreadsheet error. Mathematically, no single percentage can grow a negative into a positive and stay consistent year to year.
CAGR of the ending value being lower than the start is fine — that simply produces a negative CAGR, which is perfectly valid and just means your investment shrank on an annualized basis (as in the −13.4% example earlier). The problem is only a zero or negative base. When your starting figure is negative, most analysts switch to a plain percentage-change or "relative growth" measure, or explicitly note the assumptions rather than forcing a CAGR that cannot be interpreted cleanly. For ordinary investing — where you start with a positive amount and end with another positive amount — none of this applies, and the standard formula works every time.
Calculate Your CAGR Instantly
The exponent math is awkward to do by hand and easy to fumble. Let the calculator do it, then use the rate to plan ahead.
Enter your beginning value, ending value, and number of years
Get your exact CAGR in any of 10 currencies
Project future value with a lumpsum or SIP plan
Once you have a CAGR you trust, plug it into the lumpsum calculator to project future value, or the SWP calculator to see how long that growth rate can sustain withdrawals in retirement. To understand how the timing of a single large investment affects your realized CAGR, read our lump sum timing strategy guide.
People Also Ask
Common questions from Google searches
How do you calculate CAGR quickly?
Divide the ending value by the beginning value, raise the result to the power of 1 divided by the number of years, then subtract 1 and multiply by 100. For $10,000 growing to $18,000 over 5 years: (18,000 ÷ 10,000)^(1/5) − 1 = 12.47%. In Excel, =RATE(5, 0, −10000, 18000) returns the same figure.
Is a 12% CAGR good?
For a diversified equity portfolio held over the long run, a 12% CAGR is very good — it sits at the top of the historical range for broad indices like the S&P 500. For a high-risk individual stock, 12% may be a modest reward for the volatility involved. Always judge CAGR against the risk taken and the asset class.
Why is CAGR lower than my average return?
Because CAGR accounts for compounding and the asymmetry of gains and losses, while a simple average does not. A 50% gain followed by a 50% loss averages to 0% but produces a −13.4% CAGR, since the loss is applied to a larger base. The more volatile the returns, the bigger the gap.
What is the difference between CAGR and IRR?
CAGR measures smoothed annual growth between a single start value and end value with no money added or withdrawn in between. IRR accounts for the timing and size of every cash flow, so it is the correct measure for regular contributions like a SIP. With no interim cash flows, CAGR and IRR give the same answer.
How do you calculate CAGR for a period less than a year, like in months?
Convert the holding period into a fraction of a year, then use the normal formula. For 30 months, years = 30 ÷ 12 = 2.5, so CAGR = (Ending ÷ Beginning)^(1/2.5) − 1. Be cautious annualizing periods under about six months — scaling a short lucky streak up to a full year can produce a wildly overstated rate, so report the plain holding-period return instead.
Can CAGR be negative or calculated with negative numbers?
CAGR can absolutely be negative — that just means your investment shrank on an annualized basis, like the −13.4% example from a 50% gain followed by a 50% loss. What breaks the formula is a beginning value of zero (you cannot divide by zero) or a negative starting value, since a fractional root of a negative number is undefined. For a negative base, use a plain percentage-change measure instead.
Frequently Asked Questions
How do you calculate CAGR?
Use the formula CAGR = (Ending Value ÷ Beginning Value)^(1 ÷ Number of Years) − 1, then multiply by 100 for a percentage. Example: $10,000 growing to $18,000 over 5 years gives (18,000 ÷ 10,000)^(1/5) − 1 = 12.47% CAGR.
Is CAGR the same as average return?
No. Average return is the simple mean of yearly returns and ignores compounding, so it overstates performance when returns are volatile. CAGR is the true compounded annual rate. For example, +50% then −50% averages to 0% but the real CAGR is −13.4% per year because you actually lost money.
What is a good CAGR for an investment?
It depends on the asset and risk. Broad equity index funds have historically delivered roughly 7–12% CAGR over the long run, bonds 4–7%, and savings accounts 2–6%. A 9% CAGR from a diversified index fund is excellent; the same 9% from a high-risk speculative stock is a poor reward for the risk taken.
How do you calculate CAGR in Excel?
Use either =(Ending÷Beginning)^(1÷Years)−1 or the built-in =RATE(Years, 0, −Beginning, Ending) function, then format the cell as a percentage. For example, =RATE(5, 0, −10000, 18000) returns 12.47%. The RATE method avoids typing the exponent manually and is the quickest way to calculate CAGR in Excel or Google Sheets.
What are the limitations of CAGR?
CAGR hides volatility (two portfolios with the same CAGR can have very different worst years), assumes no cash flows in or out, is backward-looking, and is highly sensitive to the start and end dates you pick. For investments with regular contributions like a SIP, use XIRR instead of plain CAGR.
Related Articles
Investment Risk Disclaimer
This content is for educational purposes only and should not be considered financial advice. All investments carry risk, including the potential loss of principal. Past performance does not guarantee future results. Before making any investment decisions, please consult with a qualified financial advisor who understands your personal financial situation, risk tolerance, and investment goals.
Stock Averager provides tools and educational content but does not provide personalized investment advice or recommendations.
About Stock Averager Team
Expert financial analysts dedicated to simplifying complex investment strategies for everyone. We build tools that help you make better money decisions.