How to Read an Options Chain: A Complete Step-by-Step Guide
Learning how to read an options chain for beginners can feel like staring at a wall of numbers — strikes, bids, asks, volumes, open interest, Greeks. Most beginners either ignore the chain or feel overwhelmed by it. But once you know where to look, it tells you everything about market expectations, smart-money positioning, and the right strikes to trade.
Key Takeaways
5 points- 1The options chain shows all available strikes, expirations, bids, asks, IV, and Greeks for one underlying asset.
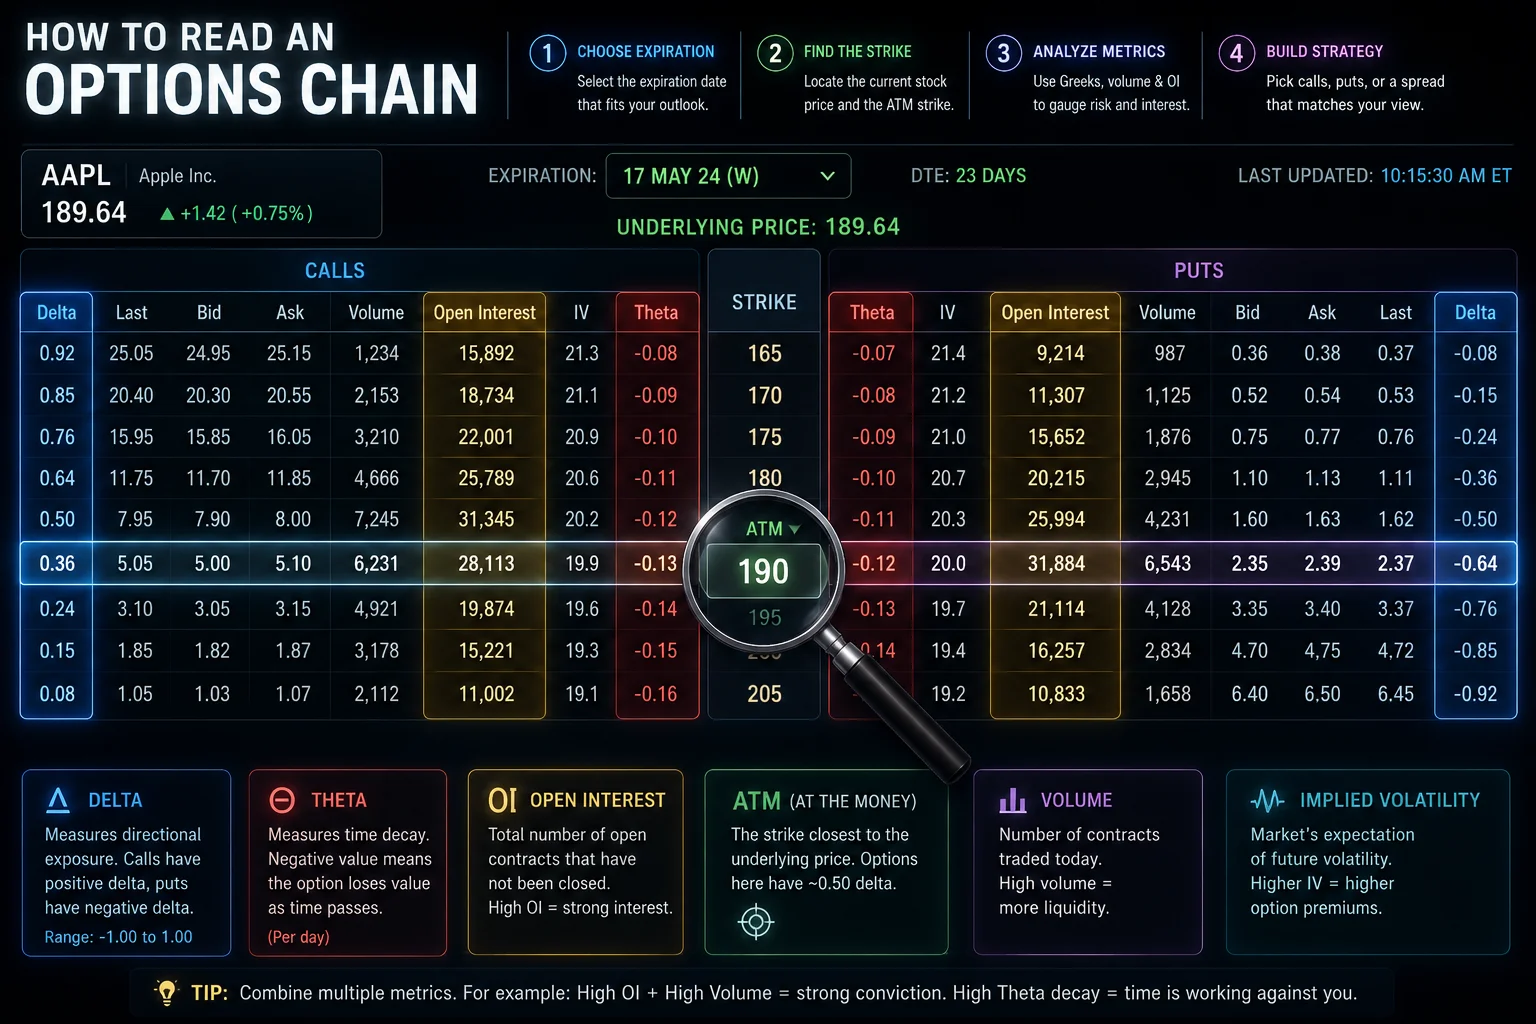
- 2Calls are on the left, Puts on the right (or in separate tabs). ATM strike is in the middle.
- 3Open Interest = total outstanding contracts. High OI at a strike = key support/resistance level.
- 4IV skew: OTM puts often have higher IV than OTM calls — 'put skew.' Use this to find mispriced options.
- 5Use Delta to find the right strike: ~0.30 Delta for sellers, ~0.50-0.70 Delta for directional buyers.
Updated for May 2026
What's new in modern options chains
- • IV Rank and IV Percentile are now standard columns. Most retail platforms (Tastytrade, ThinkorSwim, Interactive Brokers, Dhan, Sensibull) now display IV Rank directly in the chain. IV Rank > 50 favors option sellers; IV Rank < 20 favors option buyers. Use this before picking a strategy, not after.
- • Daily and 0DTE expirations dominate volume. SPX, QQQ, and several Indian indices now offer same-day expiry contracts. Open interest at near-the-money strikes on 0DTE chains is one of the loudest market signals — pin risk and gamma walls are real for the last hour of the session.
- • "Smart-money" GEX overlays. Gamma Exposure (GEX) and Charm flow indicators are now built into several broker chains. A large positive GEX cluster at a strike often acts as a magnet into expiry — useful context that pure OI alone misses.
- • Liquidity warnings on weeklies. Friday weekly chains are now flagged for low liquidity outside the front 3-5 strikes. Always check the bid/ask spread before paying mid — a quoted ₹0.50 mid can cost ₹0.65-0.70 in practice on illiquid strikes.
What Is an Options Chain?
An options chain (also called an options matrix or options table) displays all available option contracts for a specific underlying asset — arranged by expiration date and strike price. So what is an options chain in practical terms? It's your primary interface for selecting and analyzing options before trading, showing every strike you could buy or sell alongside its price and risk metrics.
Options Chain Structure: Column by Column
| Column | What It Means | How to Use It |
|---|---|---|
| Strike | The price at which you can buy (call) or sell (put) the underlying | Select based on your directional target and Delta |
| Bid / Ask | Best buy and sell prices in the market | Mid-price is fair value. Wide spread = illiquid, avoid |
| Last | Price of the most recent trade | Less reliable than bid/ask for liquid options |
| Volume | Contracts traded today | High volume = active interest, better fills |
| Open Interest (OI) | Total outstanding contracts | High OI = key strike; max pain calculation uses OI |
| IV (Implied Volatility) | Market's expected future volatility for this option | Compare to historical IV to see if overpriced or cheap |
| Delta | Price sensitivity to $1 underlying move | 0.30 for sellers; 0.50-0.70 for directional buyers |
| Theta | Daily time decay in dollars | Sellers want high theta; buyers want low theta |
| Gamma | Rate of Delta change | High = risky near expiry; look for manageable Gamma |
| Vega | Sensitivity to 1% IV change | Compare to IV rank — are you buying/selling at fair IV? |
How to Find the Right Strike Using Delta
If you are wondering how to select a strike price using Delta, it is your most practical guide for strike selection:
- 0.70-0.90 Delta calls: Deep ITM. High premium, moves almost like the stock. Used for stock replacement strategies.
- 0.45-0.55 Delta calls: ATM. Highest Gamma and Theta. Breakeven is roughly at current price. Best for directional bets with highest leverage.
- 0.25-0.35 Delta calls: Slightly OTM. Popular for sellers (credit spreads, covered calls). Win ~70% of the time at expiry.
- 0.10-0.20 Delta calls: Far OTM. Cheap, high-leverage lottery tickets. Win rarely. Avoid unless you have a specific catalyst thesis.
Open Interest: Where Smart Money Sits
If you have ever asked what open interest means in an options chain, it is simply the number of contracts that haven't been closed. High OI at specific strikes reveals where the market has concentrated positions — often acting as support/resistance. Understanding the difference between volume vs open interest in options is key here: volume resets daily, while open interest accumulates and shows lasting commitment.
The max pain theory: the stock tends to move toward the strike with the highest OI at expiration (because that's where option sellers profit most). While not always accurate, it's a useful reference point for weekly options traders.
IV Skew: What It Tells You
In most equity options chains, OTM puts have higher IV than OTM calls — called "put skew." This reflects market participants paying extra for downside protection (insurance). You can exploit this:
- Selling put spreads: You're selling overpriced OTM puts relative to their fair value.
- Buying call spreads: OTM calls are relatively cheaper than puts at the same Delta level.
- Comparing strikes: The skew tells you which side of the chain is "expensive" vs. "cheap."
How to Read an Options Chain for Day Trading
Day traders read the chain differently from swing traders. For intraday and 0DTE plays, focus on the front-expiry near-the-money strikes where volume and liquidity are deepest, and watch how open interest builds through the session for gamma walls and pin levels. Always confirm a tight bid/ask spread before entering — slippage on illiquid strikes destroys short-term edge faster than a wrong directional call. Use IV Rank to decide whether you should be a net buyer or seller of premium that day, then size positions for the fast Theta and Gamma swings near expiry. You can model these payoffs with our Options Profit Calculator before risking capital.
Practice with the Calculator
Use our Options Greeks Calculator to look up the Greeks for any strike before placing the trade. Enter the strike, expiry, underlying price, and IV from your broker's chain — the calculator shows Delta, Gamma, Theta, and Vega so you can evaluate the trade's risk profile.
Disclaimer
Options trading involves significant risk and is not suitable for all investors. This is for educational purposes only. Paper trade before using real capital.
About Stock Averager Team
Expert financial analysts dedicated to simplifying complex investment strategies for everyone. We build tools that help you make better money decisions.