RSI Indicator: How to Spot Overbought Stocks
Everyone loves to buy "low" and sell "high," but how do you know what "high" is? The Relative Strength Index (RSI) is the speedometer of the market. It tells you when the engine is overheating (Overbought) and when the tank is empty (Oversold). Master this oscillator to stop chasing tops and start catching bottoms.
Key Takeaways
6 points- 1The Speedometer: RSI measures the magnitude of recent price changes to evaluate overbought or oversold conditions.
- 2The Zones: Traditionally, RSI above 70 is 'Overbought' (Sell signal) and below 30 is 'Oversold' (Buy signal).
- 3The Divergence: The most powerful RSI signal is 'Divergence' -- when price makes a new high but RSI makes a lower high (Reversal Warning).
- 4Trend Context: In strong bull markets, RSI can stay 'Overbought' for weeks. Don't short just because it hit 70.
- 5Swing Failure: A specific pattern (Swing Failure Pattern) on the RSI line often marks exact market tops and bottoms.
- 6Andrew Cardwell's Rules: RSI ranges shift during bull markets (40-80) vs bear markets (20-60).
Who This Is For
Advanced LevelPerfect if you:
- You constantly buy right at the top before a crash
- You sell too early because you think the price looks 'too high'
- You want to identify trend reversals before they happen
- You need a momentum filter for your existing strategy
You'll learn:
- How to calculate and interpret the RSI (0-100 scale)
- Why blindly trading the 70/30 levels loses money
- How to spot and trade 'Bearish Divergence' and 'Bullish Divergence'
- The 'RSI Trendline' break strategy
- Advanced 'Positive Reversals' and hidden divergence
Part 1: What is the RSI?
If you have ever wondered what the RSI indicator is in stock trading for beginners, here is the simple answer: the Relative Strength Index (RSI) is a momentum oscillator that measures the speed and change of price movements. It oscillates between zero and 100. It was developed by J. Welles Wilder in his seminal 1978 book, New Concepts in Technical Trading Systems -- the same book that introduced the ATR (Average True Range) and Parabolic SAR. Wilder was an engineer, and he designed the RSI to solve the problem of "whipsaws" in trend-following systems.
Think of a car speeding up a hill. As it climbs, the engine works hard (Momentum increases). Eventually, if the hill is too steep, the car might keep moving forward, but it slows down (Momentum decreases). The RSI measures this internal strength. It tells you if the current price move is sustainable or if it is running on fumes.
The Temperature Check
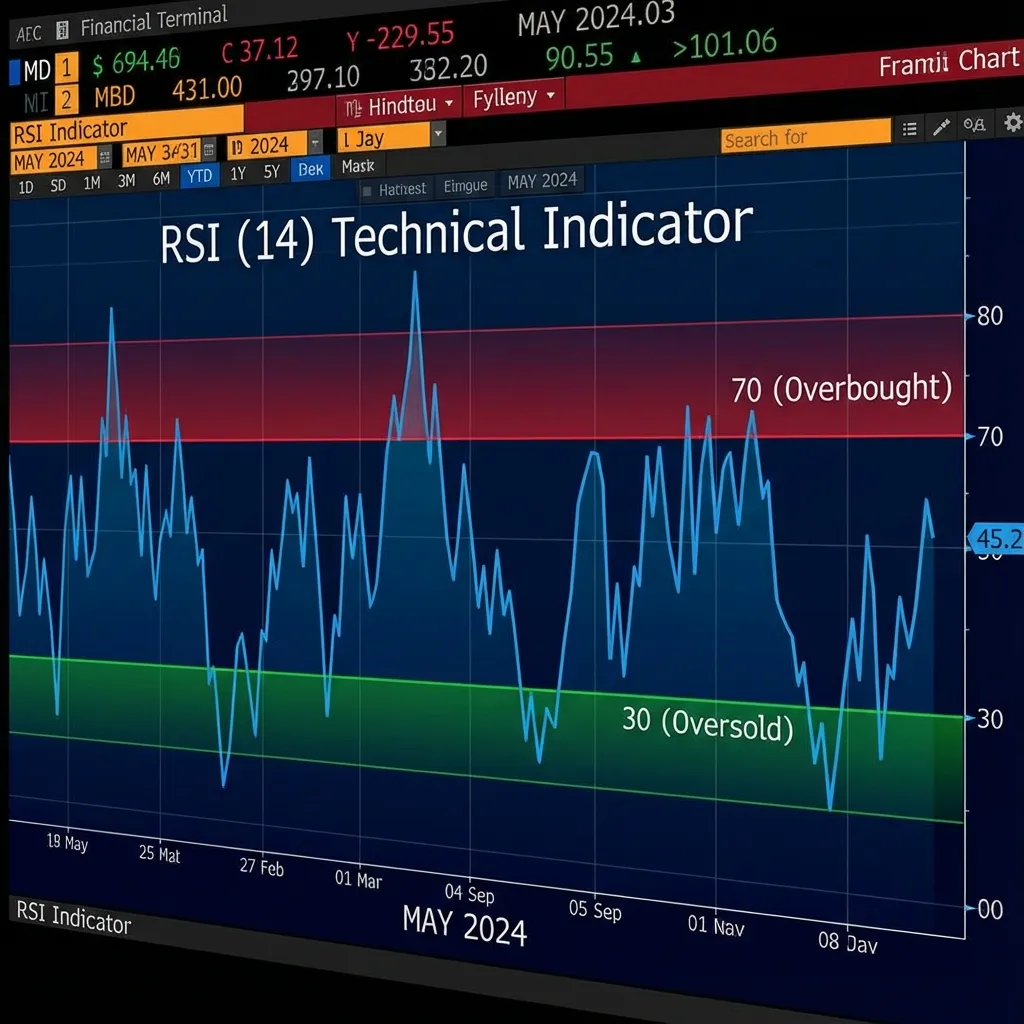
- RSI > 70Overbought (Hot): Buyers are exhausted. Price has moved up too fast. Probability of a pullback increases.
- RSI < 30Oversold (Cold): Sellers are exhausted. Panic selling has occurred. Probability of a bounce increases.
- RSI = 50Neutral: The midpoint. Above 50 is generally bullish territory; below 50 is bearish.
The Calculation (For Geeks)
You don't need to calculate this manually (computers do it), but understanding the math helps you trust the tool.
RSI = 100 - (100 / (1 + RS))
Where RS (Relative Strength) = Average Gain of 'n' days / Average Loss of 'n' days.
Translation: It compares the size of green candles vs. red candles over the last 14 periods. If the last 14 days were all massive green candles, RSI goes to 100. If all massive red, it goes to 0. It is a ratio of winning strength vs losing strength.
Part 2: The Biggest Myth (Don't Do This!)
The "Blind Reversal" Trap
Mistake: Buying just because RSI hits 30, or Shorting because RSI hits 70.
Reality: In a strong trend, RSI can stay overbought (>70) for weeks while the price doubles. If you shorted Tesla or Nvidia every time RSI hit 70 during their bull runs, you would be bankrupt.
Rule: Overbought means "Strong", not necessarily "Reversing."
So if we can't trade the levels blindly, how to use the RSI indicator to find entry and exit points reliably? We stop trading the raw numbers and instead look for failure. We look for discrepancies between price and momentum.
Part 3: The Secret Weapon - Divergence
Divergence is the single most reliable signal in technical analysis, and learning how to spot bullish and bearish RSI divergence separates profitable traders from the crowd. It happens when the Price tells a lie, but the RSI tells the truth. It represents a disconnect between price action and momentum.
Bearish Divergence (Top Signal)
- • Price: Makes a Higher High (LH) ↗️
- • RSI: Makes a Lower High (LL) ↘️
Meaning: The price pushed higher, but with less momentum than before. The bulls are running out of gas. A crash is likely imminent.
Bullish Divergence (Bottom Signal)
- • Price: Makes a Lower Low (LL) ↘️
- • RSI: Makes a Higher Low (HL) ↗️
Meaning: The price dropped lower, but selling pressure decreased. The bears are exhausted. This is a prime "Buy the Dip" signal.
Case Study: Bitcoin 2021 Top
Educational ExampleHow Divergence predicted the $69k crash
In April 2021, Bitcoin hits $64,000. RSI is at 85 (extremely Overbought). The FOMO is intense.
Price dips, then rallies violently in November 2021 to a new All-Time High of $69,000. Headlines scream "$100k incoming!"
Even though Price hit $69k (Higher High), the RSI only reached 65 (Lower High). It failed to get back to 85. Momentum was draining.
The momentum was gone. Smart money sold the divergence. Bitcoin crashed from $69k to $15k over the next year.
This is a hypothetical scenario using historical market data for educational purposes only. Past performance does not guarantee future results.
Part 4: Advanced Strategy - Swing Failure Pattern (SFP)
Commonly used by professional crypto and forex traders to snipe exact tops. This setup focuses on the RSI breaking back into the range.
The SFP Setup (Sell Setup)
- RSI breaks above 70 (e.g., hits 75). This alerts you to watch the chart.
- RSI dips back down below 70 (e.g., to 65). This is the setup phase.
- RSI rallies again but fails to break the previous high of 75. It forms a lower high.
- RSI breaks below its recent swing low.
This "M" shape on the RSI indicator is often the trigger to enter a Short position. It indicates a failed attempt by bulls to regain control.
Part 5: Advanced RSI Theory - Andrew Cardwell
Most traders stop at Wilder's 70/30 levels. But Andrew Cardwell, the "RSI Student," revolutionized the indicator by discovering that the ranges shift depending on the trend.
Bull Market Range
In a Bull Market, RSI tends to oscillate between 40 and 80. The "Oversold" level is actually 40, not 30. If RSI hits 40 and bounces, it is a strong buy signal (Positive Reversal).
Bear Market Range
In a Bear Market, RSI tends to oscillate between 20 and 60. The "Overbought" level becomes 60. Rallies die at 60.
Pro Tip: Use the "Range Shift" to identify trend changes. If the market has been in a bear trend (peaking at 60), and suddenly RSI pushes to 75, the bear market is over. A new bull trend has begun.
Part 6: RSI Trendlines & The Connie Brown Shift
A little-known secret of RSI is that you can draw trendlines directly on the indicator window, just like you do on price charts.
The Leading Indicator Effect
Often, the RSI will break its own downtrend line before the price breaks its downtrend line. This gives you an early warning "heads up" that a move is starting. Professional traders often buy the RSI trendline breakout before the price breakout.
Hidden Divergence
While regular divergence signals reversals, "Hidden Divergence" signals trend continuation.
- Hidden Bullish: Price makes a Higher Low, but RSI makes a Lower Low. This means the pullback was oversold, and the uptrend will resume.
Part 7: Combining RSI with Moving Averages
No indicator should be an island. The best strategy is to combine the "Trend" (Moving Averages) with the "Momentum" (RSI).
This strategy filters out the bad "Oversold" signals (catching a falling knife) by ensuring you are trading in the direction of the dominant trend.
RSI vs MACD: Which Momentum Indicator Should Beginners Use?
A common question is the difference between RSI and MACD for beginners deciding which oscillator to trust. RSI is a bounded oscillator (0-100) that excels at measuring exhaustion and spotting overbought or oversold extremes, making it ideal for timing reversals and pullback entries. MACD, by contrast, is an unbounded trend-following tool built from moving averages, so it is better at confirming the strength and direction of an established trend. Beginners are usually best served by learning RSI first because its fixed scale makes overbought and oversold conditions visually obvious. Once comfortable, pair the two: use RSI for entry timing and MACD for trend confirmation, then size your positions with a break-even calculator so you always know your true cost basis before the trade.
Part 8: Building an RSI Algo Bot
For the developers reading this, RSI is one of the easiest indicators to automate because it has clear, mathematical bounds. Here is a simple logic structure for a mean-reversion bot:
// Python / Pseudo-code Logic
def evaluate_rsi_strategy(price_data, period=14):
    rsi = calculate_rsi(price_data, period)
    current_rsi = rsi[-1]
    prev_rsi = rsi[-2]

    # Buy Signal: Crossing UP above 30
    if prev_rsi < 30 and current_rsi > 30:
        return "BUY"

    # Sell Signal: Crossing DOWN below 70
    elif prev_rsi > 70 and current_rsi < 70:
        return "SELL"

    return "HOLD"
Note: While this code works, it is profitable only in ranging markets. In trending markets, it will lose money. To fix this, add a trend filter: if price > 200_sma and rsi < 30: Buy.
FAQ: Mastering RSI
Should I change the default settings (14)?
What does RSI 50 mean?
Can RSI stay oversold forever?
Does RSI work on Intra-day charts?
Start Implementing Today
RSI is powerful because it visualizes the one thing price charts hide: exhaustion. Use it to time your exits and spot early entries, but never use it in isolation.
Add 'Relative Strength Index' to your chart.
Mark the 70 and 30 lines clearly.
Look for Divergence at double-tops.
Investment Risk Disclaimer
This content is for educational purposes only and should not be considered financial advice. All investments carry risk, including the potential loss of principal. Past performance does not guarantee future results. Before making any investment decisions, please consult with a qualified financial advisor who understands your personal financial situation, risk tolerance, and investment goals.
Stock Averager provides tools and educational content but does not provide personalized investment advice or recommendations.
About Stock Averager Team
Expert financial analysts dedicated to simplifying complex investment strategies for everyone. We build tools that help you make better money decisions.