
How Many Shares Do You Need to Make $1 Million? (Real Math)
Two Questions, One Piece of Arithmetic
Every investor eventually asks some version of these two questions. "If a share costs $50, how many do I need to make a million?" And, looking at an old position: "I own 1,000 shares at a $17 cost basis — what is that worth today?"
Both come down to the same two-number formula: shares × price. The first question is that formula solved for shares; the second is it solved for value. What makes them interesting is not the multiplication — it's the assumptions hiding inside the word "make." This guide works through both with real numbers, then covers the parts that quietly change the answer: splits, taxes, dividends, and time.
TL;DR — Quick Summary
30-sec read- 1To simply own $1,000,000 of a $50 stock you need 20,000 shares — that requires $1,000,000 of cash, so it answers nothing.
- 2To earn $1,000,000 in profit: Shares = $1,000,000 ÷ (Sell Price − $50). A double to $100 needs 20,000 shares; a 5-bagger to $250 needs only 5,000.
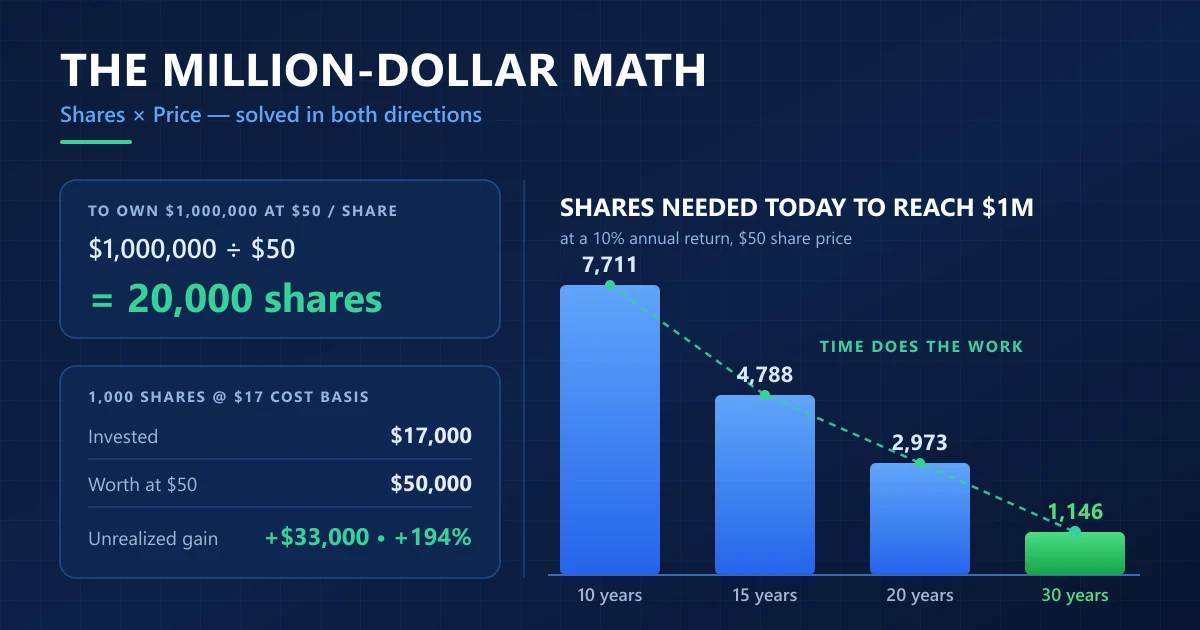
- 3The realistic route is compounding, not share count: at a 10% annual return, 2,973 shares ($148,644) becomes $1M in 20 years, and 1,146 shares ($57,309) gets there in 30.
- 41,000 shares with a $17 cost basis means $17,000 invested. Value today = 1,000 × today's price; profit = that value − $17,000.
- 5At $50 today those shares are worth $50,000 — a $33,000 gain, or +194%. The annual return depends entirely on how long you held them.
- 6Cost basis is not always your purchase price — stock splits, commissions, reinvested dividends, and averaging down all change it.
Continue reading for the full guide with examples and strategies.
Key Takeaways
6 points- 1Portfolio value = Number of Shares × Current Price. Every question in this article is that formula rearranged.
- 2Shares needed for a $1M profit = $1,000,000 ÷ (Exit Price − Entry Price). The bigger the per-share gain, the fewer shares you need.
- 320,000 shares of a $50 stock is $1,000,000 of capital — 'how many shares' is the easy half; funding them is the hard half.
- 41,000 shares at a $17 cost basis = $17,000 invested. At $50 a share today that position is worth $50,000, a gain of $33,000 (+194%).
- 5The same total gain means very different annual returns: $17 to $50 is 24.1% a year over 5 years but only 7.5% a year over 15.
- 6Unrealized value is not spendable — capital gains tax applies the moment you sell, and a low cost basis means a large taxable gain.
First: What Does "Make $1 Million" Actually Mean?
The question "how many shares do I need to make $1 million?" has three completely different answers depending on what you mean, and mixing them up is where most people's mental math goes wrong:
- Own $1 million of stock. You want a position worth seven figures. This is pure division and requires you to already have the money.
- Profit $1 million from a price move. You want the gain to be $1 million. This depends on how far the price rises, not just how many shares you hold.
- Grow into $1 million over time. You start with what you can afford and let compounding do the heavy lifting. This is the only version most people can actually execute.
Let's take all three with a $50 share price.
Version 1: How Many $50 Shares Equal $1 Million?
Shares needed to own $1,000,000
Shares = Target Value ÷ Share PriceShares = $1,000,000 ÷ $50 = 20,000 sharesAnd 20,000 × $50 = $1,000,000 of capital required today.
20,000 shares. That is the answer, and it is also the least useful one — because buying 20,000 shares at $50 costs exactly $1,000,000. You have not made a million; you have converted a million in cash into a million in stock. This version only tells you the size of a position, which is genuinely useful for planning ("how many shares must I accumulate to have a $1M holding?") but says nothing about returns.
If you want to run this for any budget and any share price — including what your leftover cash would be — the share affordability calculator does the division for you in ten currencies.
Version 2: How Many Shares to Profit $1 Million?
This is the question people usually mean. Here the share count depends on how much each share gains, so you need a second assumption: your exit price. The formula:
Shares needed for a $1,000,000 gain
Shares = $1,000,000 ÷ (Exit Price − Entry Price)Entry price here is $50. The denominator is your profit per share.
Notice what this does: the further the stock runs, the fewer shares you need — and the less capital you must put up front. That trade-off is the whole game.
Shares needed for a $1,000,000 profit (bought at $50)
| Exit Price | Profit / Share | Shares Needed | Capital at $50 |
|---|---|---|---|
| $60 (+20%) | $10 | 100,000 | $5,000,000 |
| $75 (+50%) | $25 | 40,000 | $2,000,000 |
| $100 (2×) | $50 | 20,000 | $1,000,000 |
| $150 (3×) | $100 | 10,000 | $500,000 |
| $250 (5×) | $200 | 5,000 | $250,000 |
| $550 (11×) | $500 | 2,000 | $100,000 |
| $1,050 (21×) | $1,000 | 1,000 | $50,000 |
Read the last column carefully. Every row produces the same $1,000,000 profit, but the capital required ranges from $50,000 to $5,000,000 — a hundredfold difference. The cheap rows demand something the expensive rows do not: a stock that multiplies many times over. Chasing a million through 1,000 shares means betting on a 21-bagger. Reaching it with 100,000 shares only needs a 20% move, but you had to be a multimillionaire first.
This is why "how many shares to make a million" is really a question about where you set your exit. Our guide on how to set a target price covers how to choose that number from fundamentals rather than wishful thinking, and the target price calculator works it out from a required return.
Version 3: The Realistic Path — Compounding, Not Share Count
Neither table above is how ordinary investors reach seven figures. They get there by holding a reasonable number of shares for a long time and letting returns compound. Once you introduce time, the question flips: instead of "how many shares do I need," it becomes "how many shares do I need today?"
Shares needed today to reach $1,000,000
Value Needed Today = $1,000,000 ÷ (1 + r)^nShares = Value Needed Today ÷ $50Where r is your annual return and n is the number of years you hold.
At a 10% annual return — roughly the long-run average for a broad equity index, before inflation — here is what a $50 stock demands of you:
Shares of a $50 stock needed today to be worth $1,000,000 (10% annual return)
| Years Held | Investment Needed | Shares at $50 |
|---|---|---|
| 10 years | $385,543 | 7,711 |
| 15 years | $239,392 | 4,788 |
| 20 years | $148,644 | 2,973 |
| 25 years | $92,296 | 1,846 |
| 30 years | $57,309 | 1,146 |
| 35 years | $35,584 | 712 |
Compare the first and last rows: needing the million in ten years costs you $385,543 today; giving it thirty-five years cuts that to $35,584. Time does roughly 90% of the work. That is the single most important number in this article — you can buy your way to a million, or you can wait your way there, and waiting is about eleven times cheaper.
You can run these projections against your own return assumption with the lumpsum calculator, or work backwards from a past result using the CAGR calculator.
What If You Buy Shares Every Month Instead?
Most people do not have $148,644 sitting idle. The alternative is accumulating shares steadily — buying roughly 20 shares a month at $50, or $1,000 a month, and letting each purchase compound from the day it lands. At the same 10% annual return:
| Years of $1,000/month | Total Invested | Portfolio Value |
|---|---|---|
| 10 years | $120,000 | $204,800 |
| 15 years | $180,000 | $414,500 |
| 20 years | $240,000 | $759,400 |
| ≈22.5 years | $270,000 | $1,000,000 |
| 25 years | $300,000 | $1,326,800 |
At roughly 22 and a half years, $270,000 of your own money has become $1,000,000 — the other $730,000 came from compounding. Note that your actual share count will not be a tidy 20 per month forever, because a rising price buys fewer shares with the same $1,000. That is dollar-cost averaging working as designed, and it is modelled properly in the SIP calculator. If the mechanics are new to you, start with our dollar-cost averaging guide.
Question 2: What Are 1,000 Shares With a $17 Cost Basis Worth Today?
Now the other direction. You hold 1,000 shares bought at an average of $17. Two numbers fall straight out of that:
The only two formulas you need
Amount Invested = 1,000 × $17 = $17,000Value Today = 1,000 × Today's PriceUnrealized Gain = Value Today − $17,000Your cost basis is locked in the past; only today's price moves.
Your total cost — the money at risk — is $17,000. Everything above that line is profit. Because the current price is the one input only you can supply, here is the position mapped across a range of prices:
1,000 shares, $17 cost basis ($17,000 invested)
| Price Today | Position Value | Unrealized Gain | Return |
|---|---|---|---|
| $17 | $17,000 | $0 | 0% |
| $25 | $25,000 | +$8,000 | +47% |
| $34 | $34,000 | +$17,000 | +100% |
| $50 | $50,000 | +$33,000 | +194% |
| $85 | $85,000 | +$68,000 | +400% |
| $120 | $120,000 | +$103,000 | +606% |
| $170 | $170,000 | +$153,000 | +900% |
Find your current price, read across. If the stock happens to trade at the $50 we used earlier, those 1,000 shares are worth $50,000 — a $33,000 unrealized gain, or roughly +194%. The position has almost tripled, which sounds spectacular until you attach a time period to it.
The Number That Actually Matters: Your Annual Return
"+194%" is a headline, not a performance measure. The same total gain is a triumph over five years and unremarkable over twenty. Converting to a compound annual growth rate tells you the truth:
| Holding Period | $17 → $50 (+194% total) | Verdict |
|---|---|---|
| 5 years | 24.1% a year | Excellent |
| 10 years | 11.4% a year | Roughly market-matching |
| 15 years | 7.5% a year | Below a typical index |
| 20 years | 5.5% a year | Underperformed badly |
A near-triple over twenty years works out to 5.5% a year — less than you would likely have earned in a plain index fund with far less single-stock risk. The formula is (50 ÷ 17)^(1 ÷ years) − 1, and the CAGR calculator does it instantly. Judging a position by its total gain alone is how people convince themselves a mediocre holding is a winner.
The $17 Cost Basis, Twelve Years Later
Educational ExampleA full worked example from purchase to potential sale
What was bought
- • 1,000 shares at $17 each
- • Total invested: $17,000
- • Held for 12 years
- • No shares added or sold since
Where it stands at $50
- • Value: 1,000 × $50 = $50,000
- • Unrealized gain: +$33,000
- • Total return: +194%
- • Annualized: 9.4% a year
The part most people forget
Selling all 1,000 shares realizes a $33,000 long-term capital gain. At a 15% long-term rate that is roughly $4,950 in tax, leaving about $45,050 in cash rather than the $50,000 on the screen. The low cost basis that makes the return look good is the same thing that makes the tax bill large. Figures are illustrative; rates vary by country and by your income.
This is a hypothetical scenario using historical market data for educational purposes only. Past performance does not guarantee future results.
Careful: Your Cost Basis May Not Be $17
The whole calculation rests on that $17, and four common events quietly change it. Before you trust your gain figure, check each:
- Stock splits. A 4-for-1 split turns 1,000 shares at $17 into 4,000 shares at $4.25. Your $17,000 total is unchanged, but comparing an old $17 basis to a post-split price would overstate your loss — or make a winner look like a disaster.
- Commissions and fees. Historically these were added to your basis. A $17,000 purchase with a $30 commission has a basis of $17,030, or $17.03 a share.
- Reinvested dividends. Every DRIP purchase creates a new tax lot at a different price. Your share count is above 1,000 and your average basis is above $17 — and those reinvestments are part of your return that the price alone never shows.
- Averaging down or up. If you bought more later, $17 is a weighted average, not a purchase price. The stock averager recalculates it across every lot, and our guide on how to calculate average stock price explains the weighting.
Total return vs price return
"Shares × price" gives you price return only. If the stock paid dividends you took as cash, that money is real return your position value does not reflect. A 3% yield collected over twelve years on a $17,000 position is several thousand dollars that never appears in the $50,000 figure. Estimate the income side with the dividend estimator.
On Paper vs In Your Pocket
A position worth $50,000 is not $50,000 of spendable money. Two deductions stand between the screen and your bank account:
| Selling 1,000 shares | At $50 | At $100 |
|---|---|---|
| Gross proceeds | $50,000 | $100,000 |
| Cost basis | −$17,000 | −$17,000 |
| Taxable gain | $33,000 | $83,000 |
| Tax at 15% long-term | −$4,950 | −$12,450 |
| Net cash to you | $45,050 | $87,550 |
Holding period matters enormously here: short-term gains are usually taxed as ordinary income, which can be double the long-term rate. Rates and holding-period rules differ by country and change over time, so treat the 15% above as an illustration and check your own jurisdiction. Model your own numbers with the capital gains calculator, and read the tax implications of averaging down if you built the position across multiple lots.
Can 1,000 Shares at $17 Ever Become $1 Million?
Now combine both questions. For a 1,000-share position to be worth $1,000,000, the stock must trade at $1,000 a share — a 58.8× move from your $17 basis. Possible, but rare enough that it should not be your plan. Here is how long that takes at various compounding rates:
| Annual Return | Years for $17,000 → $1,000,000 |
|---|---|
| 8% | 52.9 years |
| 10% | 42.7 years |
| 12% | 36.0 years |
| 15% | 29.2 years |
| 20% | 22.3 years |
A single $17,000 position left completely alone needs four decades at market-average returns. That is the honest answer — and it is exactly why the monthly-contribution table earlier reached the same million in 22 years. Adding money beats waiting on one holding. The Rule of 72 gives you the shortcut: divide 72 by your return to get the doubling time, and $17,000 needs to double roughly 5.9 times to reach a million.
Two things these tables do not show
Concentration risk. 20,000 shares of one $50 stock is a $1,000,000 bet on a single company. The share counts in this article are arithmetic, not position sizing — the same million spread across a diversified portfolio carries a fraction of the risk of ruin. See our diversification guide and index funds vs individual stocks.
Inflation. A million dollars thirty years from now buys roughly what $412,000 buys today at 3% inflation. If your goal is a million in today's purchasing power, you need closer to $2.4 million nominal — or you need to treat the returns above as real (after-inflation) rather than nominal.
Run These Numbers on Your Own Position
Swap in your share price, share count, and cost basis. Every calculator supports 10 currencies.
Find how many shares your budget buys at any price
Get your true average cost basis across every lot
Project the position forward to your seven-figure target
Once you know your basis, use the break-even calculator to find the price that gets a losing position back to flat, the lumpsum calculator to project a single holding forward, and the SIP calculator to see what regular buying does over the same period. For a losing position, break-even after averaging down covers the recovery math in detail.
The million-dollar math, clarified
How many shares do I need to make $1,000 a month?
For dividend income: Shares = ($1,000 × 12) ÷ Annual Dividend Per Share. A stock paying $2 a share annually needs 6,000 shares — about $300,000 at a $50 price. For a 4% yielding portfolio, $12,000 of annual income requires roughly $300,000 invested regardless of the share price.
Is 1,000 shares of a stock a lot?
It depends entirely on price, not count. 1,000 shares of a $2 stock is a $2,000 position; 1,000 shares of a $500 stock is $500,000. Share count is a vanity number — always judge a position by its dollar value and by what percentage of your total portfolio it represents.
How do I find my cost basis if I do not remember what I paid?
Your broker reports cost basis on the position page and on your annual tax statement (Form 1099-B in the US). If the position predates broker reporting or was transferred in, reconstruct it from trade confirmations, then adjust for any stock splits and reinvested dividends since purchase.
What is my profit if I bought at $17 and it is now $50?
Your profit per share is $50 − $17 = $33, a 194% gain. On 1,000 shares that is $33,000 of unrealized profit on $17,000 invested, making the position worth $50,000. The gain only becomes real — and taxable — when you sell.
How many shares of stock do I need to become a millionaire?
There is no fixed number, because it depends on price and time. Owning $1M of a $50 stock takes 20,000 shares outright, but at a 10% annual return just 2,973 shares ($148,644) compounds to $1M in 20 years, and 1,146 shares ($57,309) gets there in 30. Time reduces the required share count far more than stock picking does.
Frequently Asked Questions
How many shares do I need to make $1 million if each share costs $50?
To simply own $1,000,000 of stock you need 20,000 shares at $50 — but that requires $1,000,000 in cash. To make $1,000,000 in profit, use Shares = $1,000,000 ÷ (Exit Price − $50): a double to $100 needs 20,000 shares, a 3× to $150 needs 10,000, and a 5× to $250 needs only 5,000.
What is 1,000 shares with a $17 cost basis worth today?
Multiply 1,000 by today's share price. Your invested amount is 1,000 × $17 = $17,000, so your gain is the current value minus $17,000. At $50 a share the position is worth $50,000 — a $33,000 unrealized gain, or +194%. At $100 it is worth $100,000, an $83,000 gain.
How do I calculate the value of my shares?
Value = Number of Shares × Current Market Price. To find your profit, subtract your total cost (shares × cost basis per share). Remember this measures price return only — dividends you received in cash are additional return that the position value does not show.
How many shares at $50 do I need to reach $1 million through compounding?
At a 10% annual return you need $1,000,000 ÷ (1.10)^years invested today. That works out to 7,711 shares ($385,543) for 10 years, 2,973 shares ($148,644) for 20 years, and 1,146 shares ($57,309) for 30 years. Extending the horizon cuts the required share count dramatically.
Does a stock split change what my shares are worth?
No. A 4-for-1 split turns 1,000 shares at a $17 basis into 4,000 shares at a $4.25 basis, and the price falls by the same factor — your position value and total cost are unchanged. But you must adjust your recorded cost basis after a split, or your gain calculation will be badly wrong.
How much tax will I pay on a low cost basis position?
Tax applies to the gain, not the proceeds. Selling 1,000 shares bought at $17 for $100 realizes an $83,000 gain; at a 15% long-term capital gains rate that is $12,450 in tax, leaving about $87,550 in cash. Short-term gains are usually taxed at higher ordinary-income rates, and rules vary by country.
Is it better to buy more shares or hold longer to reach $1 million?
Time usually wins. Reaching $1M in 10 years at a 10% return requires $385,543 up front, while 35 years requires only $35,584 — about eleven times less capital for the same result. Adding money regularly is the strongest combination: $1,000 a month at 10% reaches $1,000,000 in roughly 22.5 years, with only $270,000 of it contributed by you.
Related Articles
Investment Risk Disclaimer
This content is for educational purposes only and should not be considered financial advice. All investments carry risk, including the potential loss of principal. Past performance does not guarantee future results. Before making any investment decisions, please consult with a qualified financial advisor who understands your personal financial situation, risk tolerance, and investment goals.
Stock Averager provides tools and educational content but does not provide personalized investment advice or recommendations.
About Stock Averager Team
Expert financial analysts dedicated to simplifying complex investment strategies for everyone. We build tools that help you make better money decisions.