How to Set a Target Price for a Stock: 4 Methods That Work
The Number You Set Before Emotion Takes Over
"I'll sell when it feels high enough" is how good gains turn into round-trips back to break-even. By the time a stock "feels" expensive, greed has usually already convinced you to hold for just a little more — right up until it gives it all back.
A target price is the number you decide before emotion enters the room — the price at which you will take profits, no debate. It turns selling from a gut reaction into a plan. Here is how the pros actually set one, using four methods you can apply to any stock today.
TL;DR — Quick Summary
30-sec read- 1A target price is the future price at which you plan to sell a stock to realize your expected gain.
- 2Setting it before you buy removes emotion from the hardest decision in investing: when to sell a winner.
- 3Four common methods: required-return goal, P/E multiple, analyst targets, and technical resistance levels.
- 4The most robust target combines a fundamental value (what it's worth) with a technical level (where it's likely to stall).
- 5Always pair an upside target with a downside stop — together they define your reward-to-risk ratio.
Continue reading for the full guide with examples and strategies.
Who This Is For
Intermediate LevelPerfect if you:
- You keep holding winners too long and watching gains evaporate
- You want a repeatable, unemotional rule for when to sell
- You've seen 'analyst price targets' quoted and want to know how they're built
- You're planning an entry and want your exit defined before you buy
You'll learn:
- What a target price actually is and why it beats selling on feel
- Four concrete methods to calculate a target — with formulas and examples
- How to combine fundamental and technical targets for higher conviction
- Why every target needs a paired stop-loss and a reward-to-risk ratio
- How to find your exact target price in seconds with a calculator
Not for you if:
💡 Being honest about who shouldn't read this builds trust and reduces bounce rate.
Key Takeaways
6 points- 1A target price (or price target) is the future price at which you plan to sell to realize your expected gain.
- 2Deciding it before you buy removes emotion from the most dangerous decision: when to sell a winner.
- 3Four methods: percentage-return goal, P/E multiple, analyst consensus, and technical resistance.
- 4The strongest target combines what a stock is worth (fundamentals) with where it's likely to stall (technicals).
- 5Always pair an upside target with a downside stop-loss — the two define your reward-to-risk ratio.
- 6Build in a margin of safety: set your target just below the level you truly expect so your order actually fills.
What Is a Target Price?
A target price is the price level at which you intend to exit a position to lock in a profit. It converts a vague hope ("I think this stock will go up") into a concrete, testable plan ("I'll sell at $180, which is a 30% gain"). When the analysts you hear on TV quote a "price target," this is exactly what they mean — their estimate of where the stock should trade within roughly twelve months.
The discipline matters more than the precision. A pre-set target stops you from two classic mistakes: panic-selling a quality stock on a dip, and riding a winner all the way back down because you got greedy. You will never nail the exact top — nobody does — but a defined target captures the bulk of a move without the emotional whipsaw.
Method 1: The Required-Return Target (Simplest)
Start from the return you want and work backward to the price. This is the cleanest method for goal-based investors — you know your number, you set the order, and you tune out the noise.
Target price formula
Target Price = Purchase Price × (1 + Required Return)Example: bought at $100, want a 25% gain → $100 × 1.25 = $125 target.
The catch: a return you want is not necessarily one the stock will deliver. A 25% target on a slow-growing utility is wishful; the same target on a fast grower may be conservative. So use this method to set your goal, then sanity-check it against the value-based methods below before committing real money.
Method 2: The P/E Multiple Target (Fundamental)
This estimates what the stock is actually worth based on its earnings — a target price calculation using the P/E ratio. You project earnings a year out, then multiply by the multiple you think the market will fairly pay.
P/E-based target
Target Price = Expected EPS × Fair P/E RatioExample: next-year EPS of $6 × a fair P/E of 20 = $120 target.
Estimate the company's earnings per share a year out, then multiply by the P/E multiple you consider fair — often the industry average or the stock's own historical P/E. If today's price sits well below that target, the stock may be undervalued. New to this? Read P/E Ratio Explained first. For companies with stable cash flows, analysts also build a target from a discounted cash flow (DCF) model — more complex, but it values the business on future cash rather than a single earnings multiple.
Method 3: Analyst Price Targets (Borrow, Don't Trust)
A 12-month price target is an analyst's estimate of where a stock should trade roughly a year out — a projection, never a guarantee to buy, hold, or sell. Brokerages publish these for most large stocks, and they are a useful reference for the consensus view.
But how accurate are analyst price targets? Often not very. Analysts are frequently too optimistic, they update slowly after news, and the headline "average target" hides a wide range of opinions. The smarter move is to look at the spread — the gap between the lowest and highest target — to gauge how uncertain the consensus really is, rather than fixating on the single average number. A tight spread signals agreement; a wide one signals the trade is a genuine coin-flip.
Method 4: Technical Resistance Targets (Where It's Likely to Stall)
Fundamentals tell you what a stock is worth; charts tell you where buyers and sellers have historically clustered. A prior high, a round number ($100, $500), or a measured move from a chart pattern often acts as a ceiling where selling pressure appears.
Setting your target just below a major resistance level increases the odds your order actually fills before the stock reverses. This is the difference between "what it deserves" and "what it'll get." A fundamentally cheap stock can still stall for months at an obvious chart level — so if your value target sits right at heavy resistance, take the exit a fraction earlier rather than hoping price punches straight through.
The Four Methods at a Glance
| Method | Based on | Best for | Weakness |
|---|---|---|---|
Required return | Your profit goal | Goal-based investors | Ignores what's realistic |
P/E multiple | Earnings × fair P/E | Valuing the business | EPS estimate can be wrong |
Analyst target | Consensus estimate | A quick reference view | Often too optimistic, slow |
Technical resistance | Chart levels | Timing the exit fill | Says nothing about value |
The Best Approach: Combine Fundamental and Technical
A target you can trust usually agrees across methods. If your P/E model says $120, the analyst consensus sits near $118, and there is clear chart resistance at $119, you have a high-conviction target zone around $118-120. When the methods disagree wildly — say your model screams $150 but the chart caps out at $110 — that mismatch is a signal the trade is more uncertain than it looks, so size the position smaller.
Build in a margin of safety
Any target you set will be at least a little wrong, so set yours a touch below the level you actually expect. That way you still profit even if the stock rises less than you hoped — and you get filled before a reversal instead of watching it stall just short of a too-greedy target. A margin of safety on the exit is as valuable as one on the entry.
Never Set a Target Without a Stop-Loss
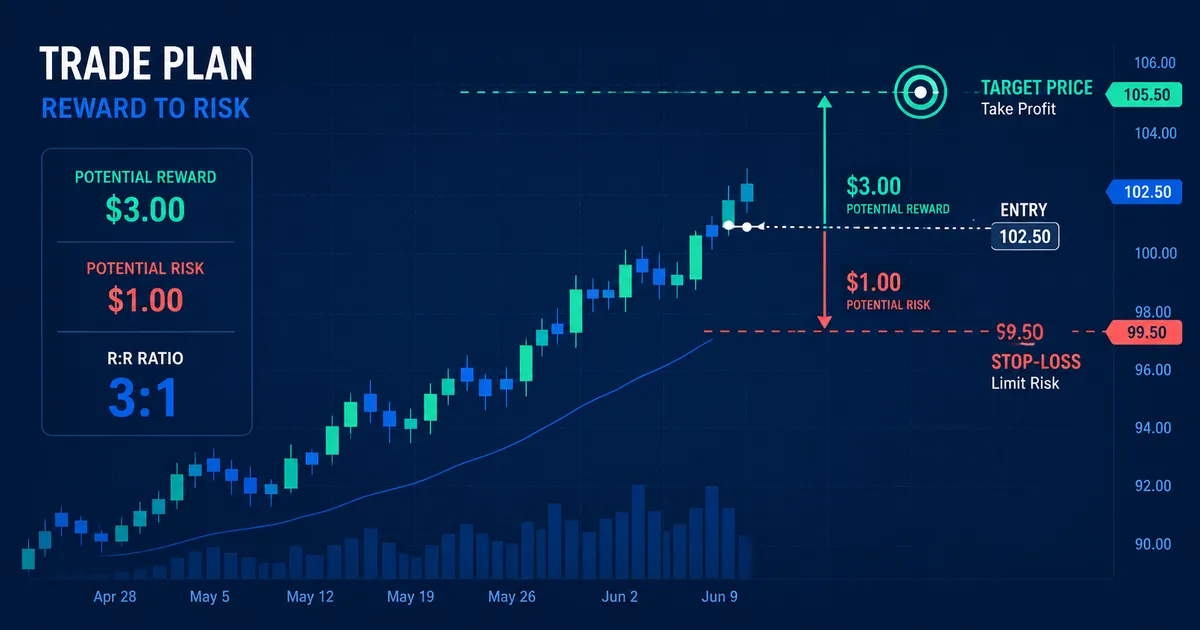
A target price defines your upside; a stop-loss defines your downside. Together they create your reward-to-risk ratio — and you should know it before entering the trade, not after. A target in isolation tells you what you hope to make while saying nothing about what you are risking to get it.
Example: Buy at $100, target $130 (+$30 upside), stop at $90 (−$10 downside). Reward-to-risk = 3:1. A 3:1 ratio means you can be right less than half the time and still make money overall. Aim for at least 2:1 on any trade — if the best target you can justify is only 1:1 against your stop, the trade is not worth taking.
Setting a Target on a $100 Stock, Four Ways
Educational ExampleA hypothetical, illustrative example — not a recommendation or prediction. Stocks frequently never reach their targets.
You are looking at a stock trading at $100. You expect next-year EPS of $6, you want at least a 25% return, and you are checking the consensus and the chart. Here is what each method produces:
- Required return (25%): $100 × 1.25 = $125
- P/E multiple ($6 EPS × 20 fair P/E): $120
- Analyst consensus: around $118, with a spread of $105-$135
- Technical resistance: a prior high near $119
Three of the four cluster tightly between $118 and $120 — a high-conviction target zone. You set your sell order at $118, a hair below resistance for margin of safety, and pair it with a stop at $90. That gives an $18 upside against a $10 downside on this leg, and defines the trade before you ever click buy.
Rather than do this arithmetic in your head, run your entry price and required return through the Target Price Calculator to get the exact number in seconds.
This is a hypothetical scenario using historical market data for educational purposes only. Past performance does not guarantee future results.
When to Revise Your Target Price
A target price is not carved in stone. The number you set at entry reflects what you knew then — and the moment the facts change, the target should change with them. The discipline is not "never move your target"; it is "only move it for a real reason, never just because the stock is climbing and you want to squeeze more." Chasing a rising price by nudging the target up every day is how you end up back where you started.
| Trigger | What it does to the target |
|---|---|
Earnings beat & raised guidance | Higher expected EPS lifts the P/E-based target — a legitimate reason to raise it |
Earnings miss or cut outlook | Lower forward earnings pull the fair value down — lower the target, don't deny it |
Multiple re-rating (sector rotation) | A fair P/E that shifts across the whole industry changes the multiple you apply |
"It's going up so fast" | Not a reason. Price alone changes nothing about value — resist the urge to chase |
A clean workflow: re-run your P/E or return math only when a fundamental input actually moves — after an earnings report, a guidance change, an acquisition, or a shift in interest rates that re-rates the whole sector. Between those events, hold your line. If you find yourself editing the target because the chart looks strong, that is emotion wearing a spreadsheet's clothing. For the reverse case — knowing your protective floor if the thesis breaks — a disciplined stop-loss order does the same job on the downside.
Common Target-Price Mistakes to Avoid
Most target-setting errors are not math errors — they are discipline errors. Here is a quick checklist of the traps that turn a sound target into a story you tell yourself:
- Setting a target with no stop. An upside number with no defined downside is a hope, not a plan. Always pair the two.
- Anchoring to your purchase price. The market does not care what you paid. A fair-value target is built from earnings and chart levels, not from "the price I need to break even."
- Placing the order exactly at round-number resistance. Everyone else's sell orders sit at $100 too. Set yours a fraction below so you fill before the crowd.
- Trusting a single analyst number. The headline average hides a wide spread. Treat it as one input among four, never the whole answer.
- Ignoring your average cost after adding shares. If you bought more on a dip, your target must be recalculated from the new blended cost, not the original entry.
The one-line test: before you buy, you should be able to say "I'll sell at X for a Y% gain, or cut it at Z for a small loss" in a single breath. If you can't, your target isn't finished. Reading support and resistance levels helps you pick a realistic X.
Find Your Exact Target Price
Working a target backward from a profit goal — or forward from a P/E estimate — is fiddly to do in your head. Get the precise sell price for any required return or profit amount, in any of 10 currencies, in seconds.
Enter your purchase price
Set your required return or profit
Get your exact sell target
Then pair it with the Break-Even Calculator to know your floor, and the Stock Averager if you are buying in multiple lots and need your true cost basis before you can set a sensible target at all.
People Also Ask
Common questions from Google searches
How do you calculate a target price for a stock?
The simplest way is Target Price = Purchase Price × (1 + Required Return): a $100 stock with a 25% goal gives a $125 target. For a value-based number, use Expected EPS × Fair P/E — say $6 EPS × a 20 multiple = $120. The most reliable target combines these fundamental estimates with a technical resistance level and a margin of safety.
What does a price target mean for a stock?
A price target is an estimate of where a stock should trade at a future point, usually about twelve months out. When an analyst issues one, it reflects their view of the stock's fair value. It's a projection, not a promise — stocks routinely miss their targets or blow past them, so treat any single number as a reference rather than a guarantee.
How accurate are analyst price targets?
Often not very. Analysts tend to be too optimistic, they update targets slowly after news breaks, and the headline average hides a wide range of individual estimates. Use them as one input, not gospel. Look at the spread between the lowest and highest target to judge how uncertain the consensus really is before relying on it.
Should I set a target price before or after I buy?
Before. Deciding your exit while you're still calm and objective removes emotion from the sell decision later, when greed or fear will be loudest. Set both an upside target and a downside stop before you buy, confirm the reward-to-risk ratio is at least 2:1, and you've turned a hopeful trade into a defined plan.
How do you set a target price using the P/E ratio?
Estimate the company's earnings per share about a year out, then multiply by the P/E multiple you think the market will fairly pay — usually the industry average or the stock's own historical P/E. For example, a projected EPS of $6 times a fair P/E of 20 gives a $120 target. If today's price sits well below that, the stock may be undervalued relative to its earnings.
When should you change or update a stock's target price?
Only when a real fundamental input moves — an earnings beat or miss, revised company guidance, an acquisition, or an interest-rate shift that re-rates the whole sector. Those genuinely change the fair value, so recalculate. What you should never do is nudge the target higher simply because the price is rising fast; chasing a strong chart is emotion, not analysis.
Frequently Asked Questions
What is a good reward-to-risk ratio for a target?
Aim for at least 2:1 — meaning your upside to the target is at least twice your downside to the stop. A 3:1 ratio is even better because it lets you be wrong more than half the time and still come out ahead. If the best target you can justify is only 1:1 against a sensible stop, the trade generally isn't worth taking.
What if a stock blows past my target price?
That's fine — you captured your planned gain, which is a win, not a mistake. If you believe the story has fundamentally improved, you can re-enter with a fresh, higher target and a new stop. What you should avoid is abandoning the discipline mid-trade and holding on pure hope; that's exactly how planned profits turn into round-trips.
Can I use a target price for long-term investing, not just trading?
Yes. Long-term investors often set a valuation-based target using a P/E multiple or DCF and trim or exit when the stock reaches clearly overvalued territory. The horizon is longer and the target updates as earnings grow, but the principle is identical: decide your sense of fair value before emotion clouds the call.
How does averaging down change my target price?
Buying more shares at a lower price lowers your average cost basis, which changes the price you need to hit your return goal. Recalculate your target from the new average cost, not your original entry. The Stock Averager gives you that blended cost basis, and the Target Price Calculator then converts it into the exact sell price for your desired return.
Is a target price a guarantee the stock will get there?
No. A target is an estimate, not a prediction. Plenty of stocks never reach their targets, and others sail far beyond them. That's precisely why you pair every target with a stop-loss — so a stock that moves against you costs a defined, small amount rather than an open-ended one.
Related Articles
Investment Risk Disclaimer
This content is for educational purposes only and should not be considered financial advice. All investments carry risk, including the potential loss of principal. Past performance does not guarantee future results. Before making any investment decisions, please consult with a qualified financial advisor who understands your personal financial situation, risk tolerance, and investment goals.
Stock Averager provides tools and educational content but does not provide personalized investment advice or recommendations.
About Stock Averager Team
Expert financial analysts dedicated to simplifying complex investment strategies for everyone. We build tools that help you make better money decisions.