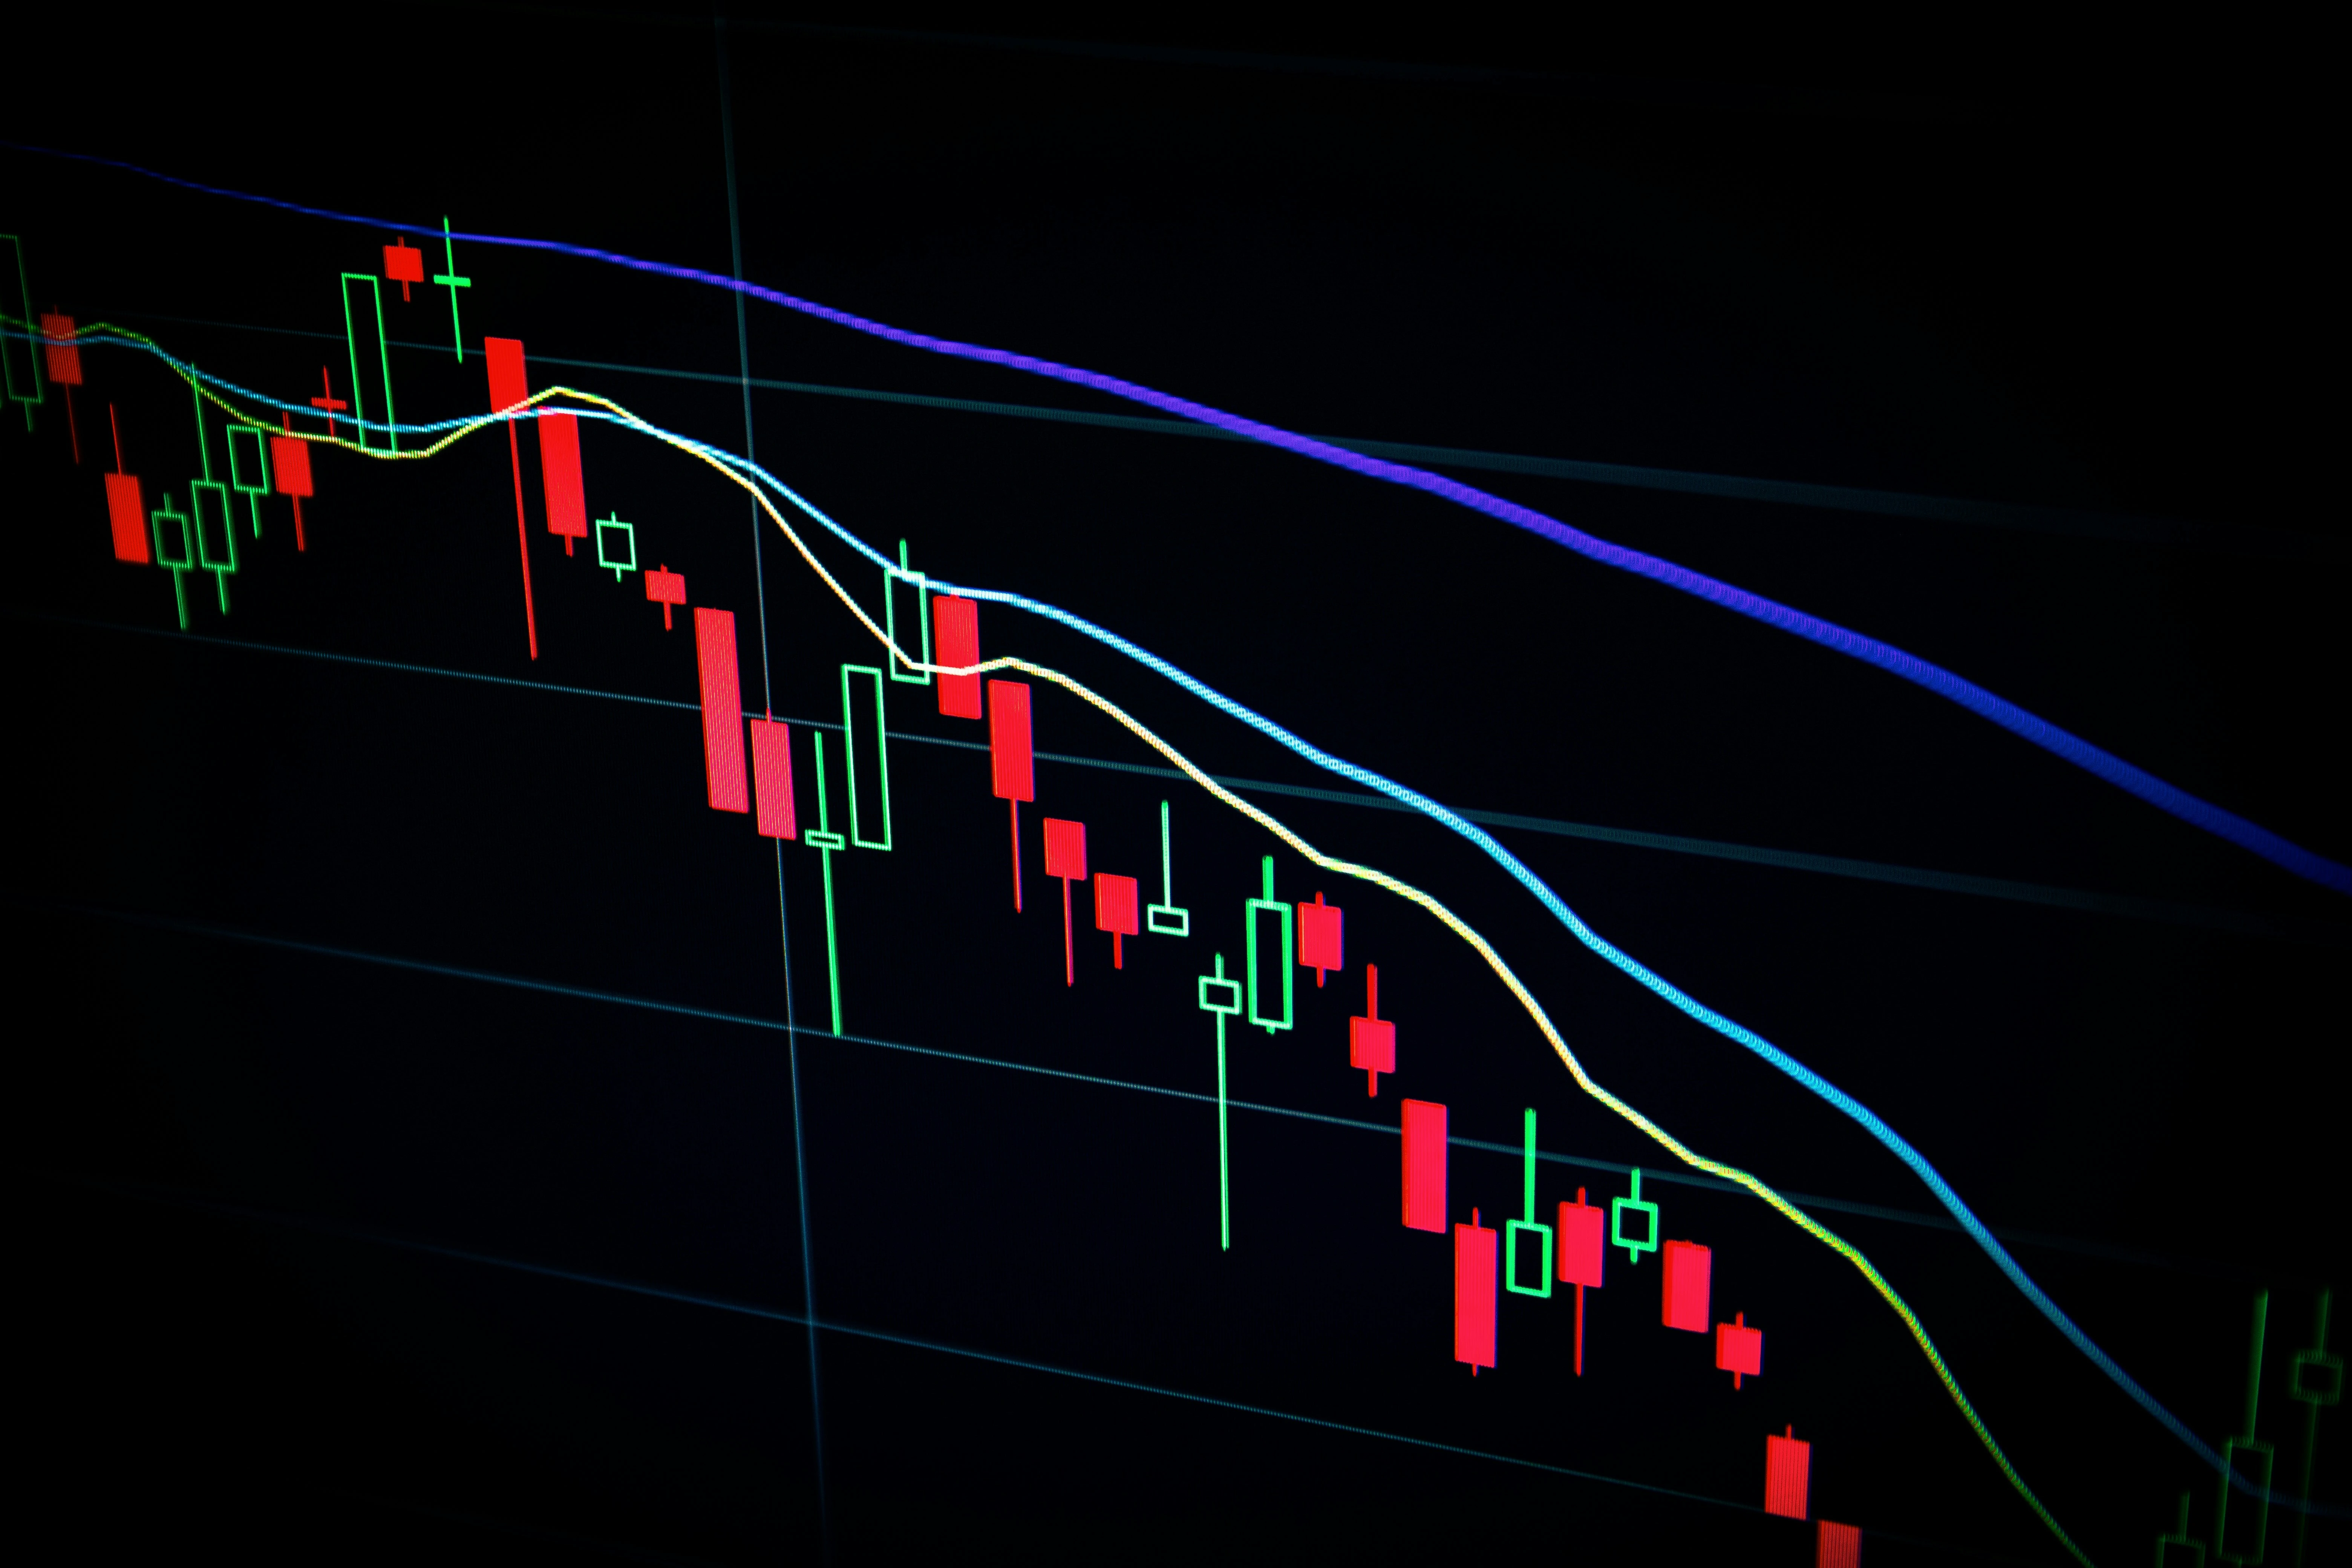
Technical analysis attracts more confident claims per square inch than any other area of investing. These guides take a deliberately deflationary view: indicators describe what price has already done, and the honest question is not "does this predict?" but "what does this measure, and over what horizon is it useful?"
Moving averages, RSI and MACD are all transformations of past price. That is not a criticism — a well-chosen summary of the recent past is genuinely informative about regime and momentum. It becomes a problem only when a lagging measure is presented as a leading signal, which is how most indicator coverage in financial media is framed.
Where the data contradicts the popular story, we say so. The death cross is the clearest example: despite its reputation as a crash warning, the S&P 500 has historically averaged positive returns in the twelve months following many of them, and the entire signal history amounts to only around 33 events across some 66 years — far too small a sample to support the confidence with which it is discussed.